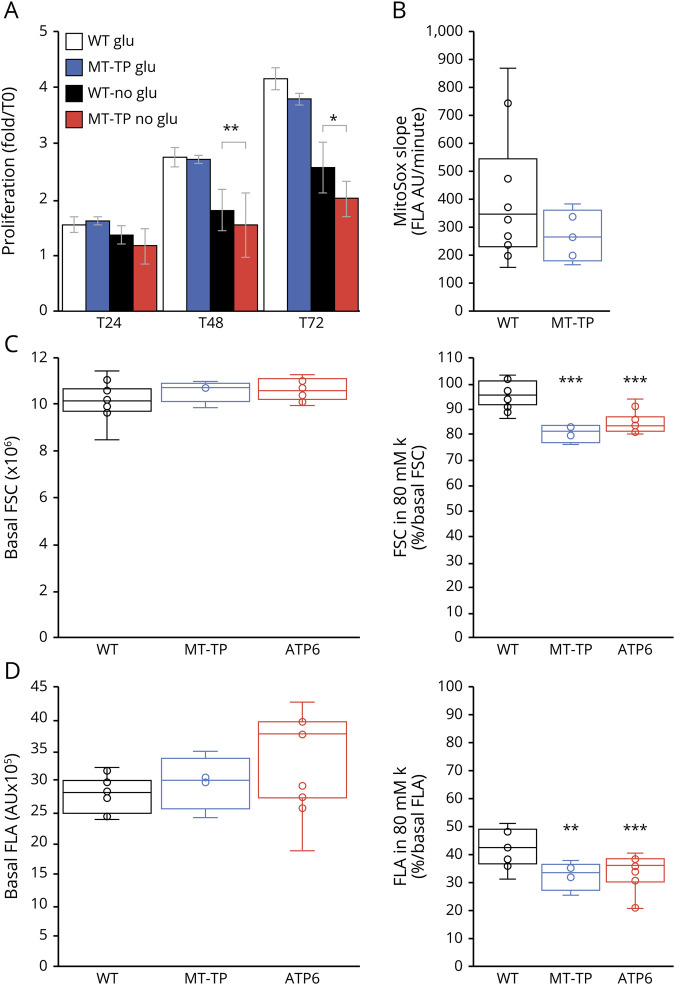
Figure 5. Functional impact of the m.15992A>T mutation outside OXPHOS pathway.
WT = wild-type cybrids; MT-TP = cybrids with 100% m.15992A>T mutation; *p < 0.05, **p < 0.01, ***p < 0.001 compared with the control group using the Mann-Whitney test or t test when data had a normal distribution according to the Shapiro-Wilk test. (A) Proliferation assay in the presence of 1 g/L glucose (glu) or in its absence but in the presence of 200 µM glutamine (no glu). Number of experiments: 9 independent assays on 3 different control cybrid lines and 7 independent assays on 6 different mutant cybrid lines. (B) Evaluation of the superoxide ion production using the slope of MitoSOX fluorescence. Results shown as a box plot with the median, the quartile, and the centile as well as internal dots; number of experiments: 10 independent assays on 5 different control cybrid lines and 5 independent measurements on 5 different cybrid lines with 100% m.15992A>T mutation. (C) Cell size evaluation using the FSC given by the Accuri 6 flow cytometer. The FSC values in the basal state (i.e., in normal culture medium with TMRE and verapamil as explained in the methods section) are given in million for the sake of readability. The FSC values in the presence of 80 mM external K are given as % of the cells FSC in the basal state. (D) Evaluation of the plasma potential using the fluorescence signal of TMRE measured in channel A (FLA) of the Accuri 6 flow cytometer. The FLA values in the basal state are given in hundreds thousands for the sake of readability. The FLA values in the presence of 80 mM external K are given as % of the cells FLA in the basal state. FSC = forward scatter; TMRE = tetramethylrhodamine ethyl esther.

