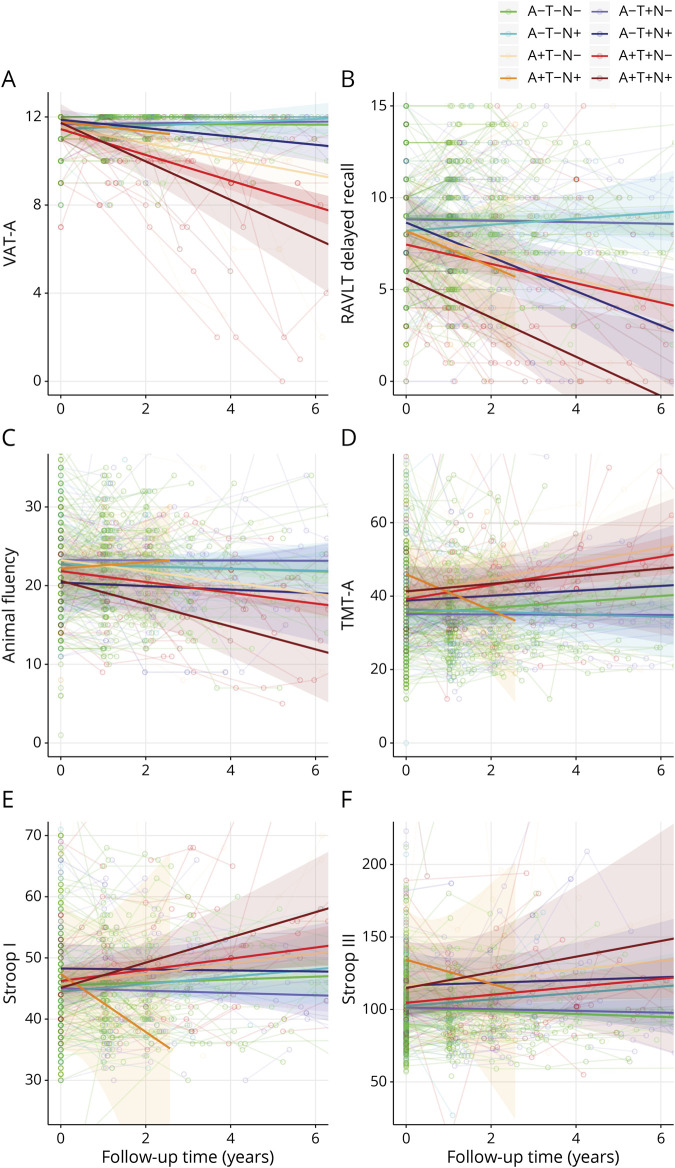
Figure 3. Spaghetti plots illustrating raw neuropsychological test performance over time in subjective cognitive decline.
Spaghetti plots show individual neuropsychological trajectories on 6 neuropsychological tests: (A) Visual Association Test version A (VAT-A); (B) Rey Auditory Verbal Learning Test (RAVLT) delayed recall; (C) animal fluency; (D) Trail-Making Test, part A (TMT-A); (E) Stroop I; (F) Stroop III. Separate lines represent the unadjusted mean trajectory of the 8 ATN profiles with 95% confidence intervals. Figures represent raw test scores.

