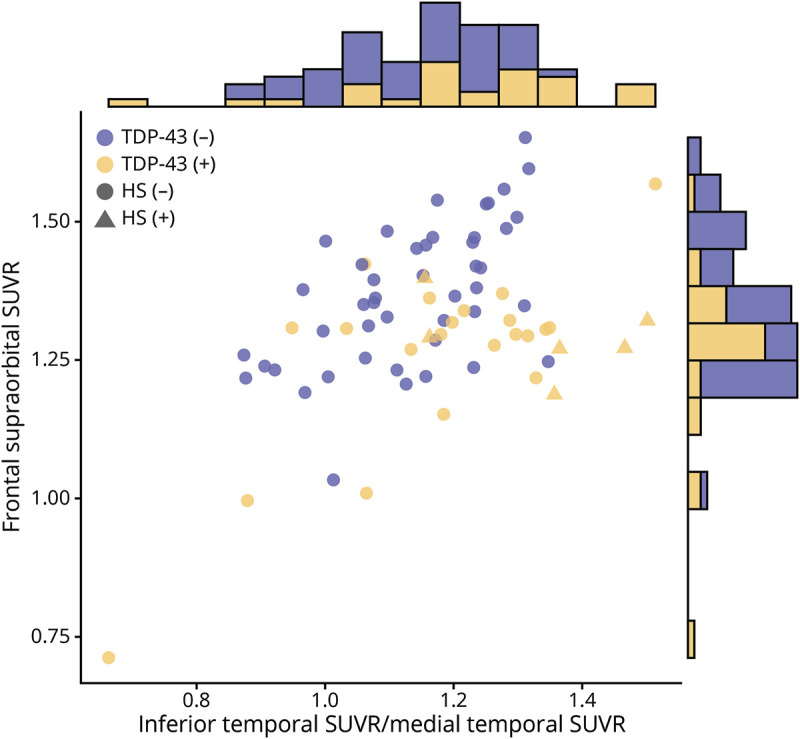
Figure 3. Scatterplot shows the relationship between inferior temporal standard uptake value ratio (SUVR)/medial temporal SUVR and frontal supraorbital SUVR values for the cohort.

Blue dots represent trans-active response DNA-binding protein of 43 kDa TDP-43(−) cases; yellow triangles (hippocampal sclerosis [HS]–positive) or dots (HS-negative) represent TDP-43(+) cases. Marginal histograms contrasting TDP-43(−) and TDP-43(+) cases for each variable individually are included. While there appears to be some separation of the patients based on TDP-43 status along the diagonal, there is a substantial overlap in both marginal histograms, making an optimal cut point difficult to establish using only one variable.
