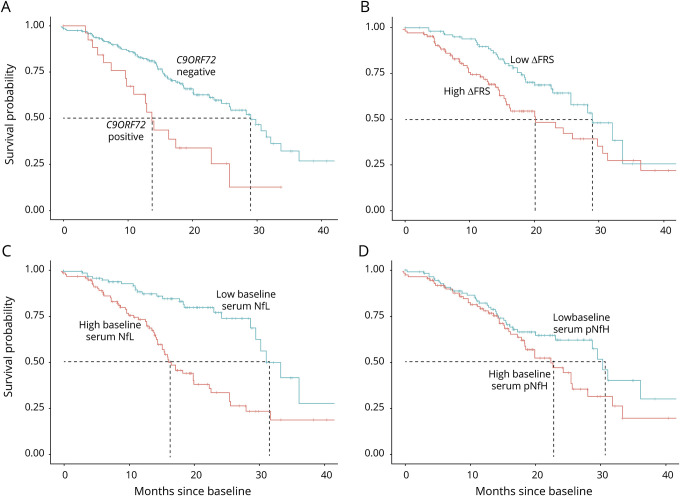
Figure 1. Kaplan-Meier survival curves.
Kaplan-Meier survival curves show the prognostic value of (A) C9ORF72 repeat expansion, (B) ∆FRS (dichotomized at the median, 0.62 points/month), (C) baseline serum neurofilament light (NfL) (dichotomized at the median, 17 pg/mL), and (D) baseline serum phosphorylated neurofilament heavy (pNfH) (dichotomized at the median, 67 pg/mL). The presence of a C9ORF72 repeat expansion, higher ∆FRS, higher baseline serum NfL, and higher baseline serum pNfH are shown in red.

