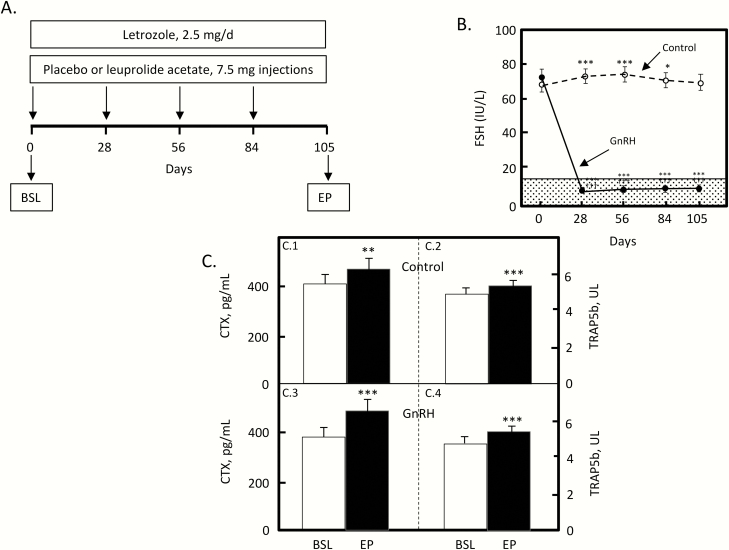
Figure 4.
(A) Overview of the study design for FSH suppression in postmenopausal women. Abbreviations: BSL, baseline; EP, endpoint. (B) Changes in serum FSH over time in the control and GnRH groups. The shaded region represents the premenopausal reference range. (C) Serum CTX (C0.1) and serum TRAP5b (C0.2) in the control women; serum CTX (C0.3) and serum TRAP5b (C0.4) in the GnRH-treated women. *P < 0.05, ***P < 0.001 vs day 0; †††P < 0.001 for comparison with the control group at the specific time point. Reproduced from Drake et al (29), with permission.

