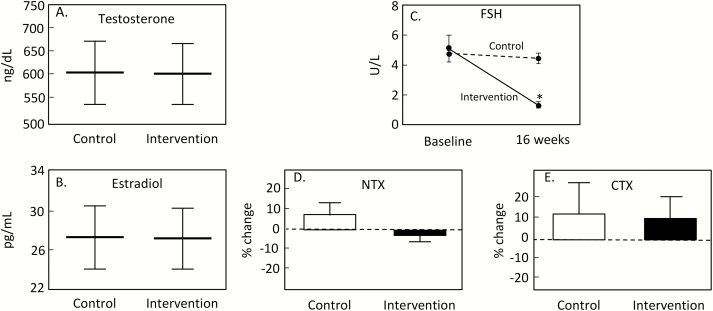
Figure 6.
Mean serum testosterone (A) and E2 levels (B) with 95% confidence intervals during the study period; (C) change in serum FSH levels in the intervention and placebo groups; *Statistical significance of between-group differences in FSH from baseline to week 16, P < 0.0001. Change in serum NTX (D) and CTX levels (E) from baseline to study completion in the intervention and placebo groups. Reproduced from Uihlein et al (31), with permission.

