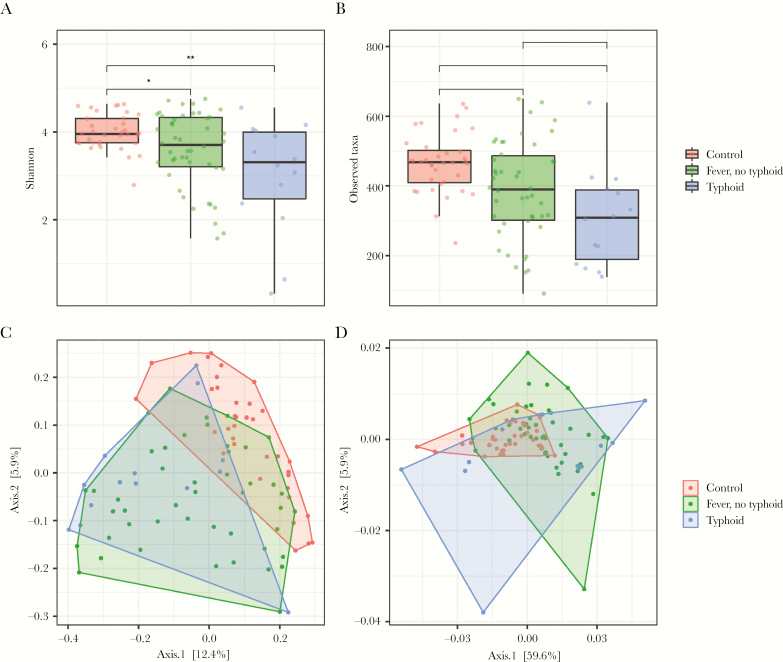
Figure 2.
Overview of differences in alpha and beta diversity among patients with nontyphoidal febrile illness (n = 46), typhoid fever (n = 14), and controls (n = 36). The Shannon index and the Observed Taxa (OT) index were used to calculate the diversity community (A) and richness (B) within each individual microbiota sample. Data are presented as a dot plot with a line at the median. Principal coordinates analysis of unweighted (C) and weighted (D) UniFrac distances of samples of patients with typhoid fever, nontyphoidal febrile illness, or healthy controls. *P < .05; **P < .01; ***P < .001.

