. 2020 Jul 6;9:e53850. doi: 10.7554/eLife.53850

Figure 4. Distractors had opposite effects on decision accuracy as a function of difficulty in all experiments.

The main effect of the distractor was different depending on decision difficulty. (a) In accordance with the predictions of the dual route model, high value distractors (D-HV is high) facilitated decision making when the decision was hard (blue bars), whereas there was a tendency for high value distractors to impair decision making when the decision was easy (red bars). Data are shown for (b) Experiment 1 fMRI2014, Experiment 2 Gluth4, Experiment 3 Hong Kong. (c) The same is true when data from the other experiments, Experiments 4–6 (i.e. Gluth1-3), are examined in a similar way. However, participants made decisions in these experiments in a different manner: they were less likely to integrate probability and magnitude features of the options in the optimal manner when making decisions and instead were more likely to choose on the basis of a weighted sum of the probability and magnitude components of the options. Thus, in Experiments 4–6 (i.e. Gluth1-3), the difficulty of a trial can be better described by the weighted sum of the magnitude and probability components associated with each option rather than the true objective value difference HV-LV. This may be because these experiments included additional ‘decoy’ trials that were particularly difficult and on which it was especially important to consider the individual attributes of the options rather than just their integrated expected value. Whatever the reason for the difference in behaviour, once an appropriate difficulty metric is constructed for these participants, the pattern of results is the same as in panel a. # p<0.1, *p<0.05, **p<0.01, ***p<0.001. Error bars indicate standard error.

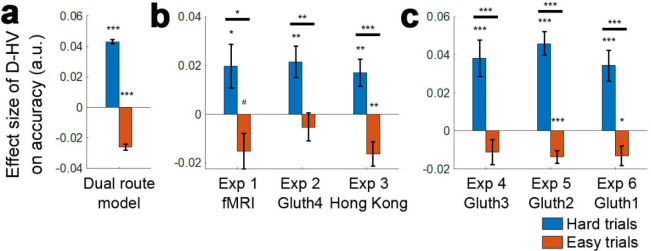
Figure 4.

Figure 4—figure supplement 1. Similar difficulty-dependent distractor effects were observed when accuracy is explained using the value of D, rather than the relative value of D in comparison to HV (i.e. D–HV).

Figure 4—figure supplement 1.

(a) Positive and negative D effects were found on hard and easy trials respectively in Experiments 1 fMRI2014, Experiment 2 Gluth4, and Experiment 3 Hong Kong, using GLM2b. As in Figure 4a, difficulty was described by HV-LV in these experiments. (b) The same pattern of D effects was also found in Experiments 4–6 (Gluth1-3) when difficulty was described by a weighted sum of the probability and magnitude components of the options, as in Figure 4b (GLM2d). (c) It is also possible to observe similar difficulty-dependent distractor effects in all six experiments by analysing all data with one single approach. First ‘novel’ trials in Experiments 2, 4–6, added by Gluth and colleagues to test decoy effects were excluded. Then choice difficulty was estimated based on a combination of HV-LV and HV+LV, instead of either the HV-LV difference or the weighted sum of magnitude and probability differences. Here HV+LV was also included because it is possible that the total value sum also contributes to the subjective difficulty level. Finally, GLM2b was applied to estimate the effect of D on hard and easy trials. # p<0.1, *p<0.05, **p<0.01, ***p<0.001. Error bars indicate standard error.
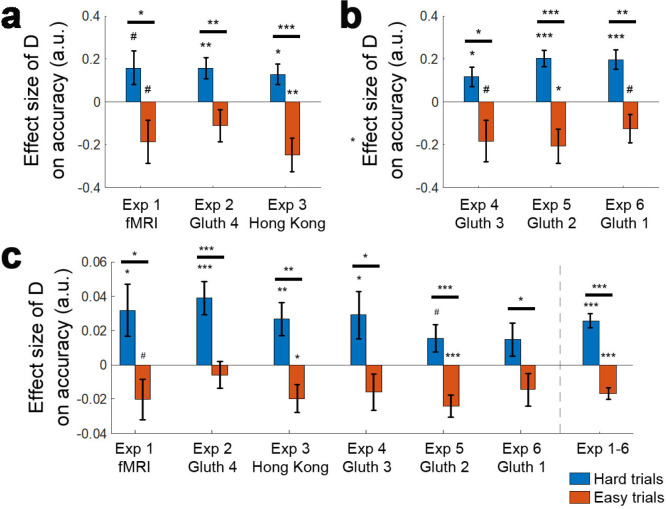
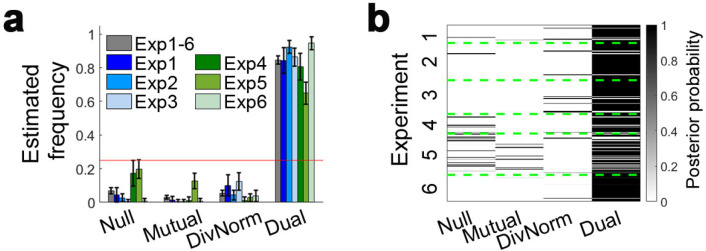
Figure 4—figure supplement 2. The dual-route model best describes participant behaviour in Experiments 1–6.

Figure 4—figure supplement 2.

(a) A model comparison shows that participant behaviour in Experiments 4 to 6, as well as Experiments 1–3 (Figure 3g–h), is best described by the dual route model, as opposed to the null, mutual inhibition, or divisive normalisation models. (b) Posterior probability of each model in accounting for the behaviour of individual participants. Null: null model; Mutual: mutual inhibition model; DivNorm: divisive normalisation model; Dual: dual route model. Error bars indicate standard deviation.