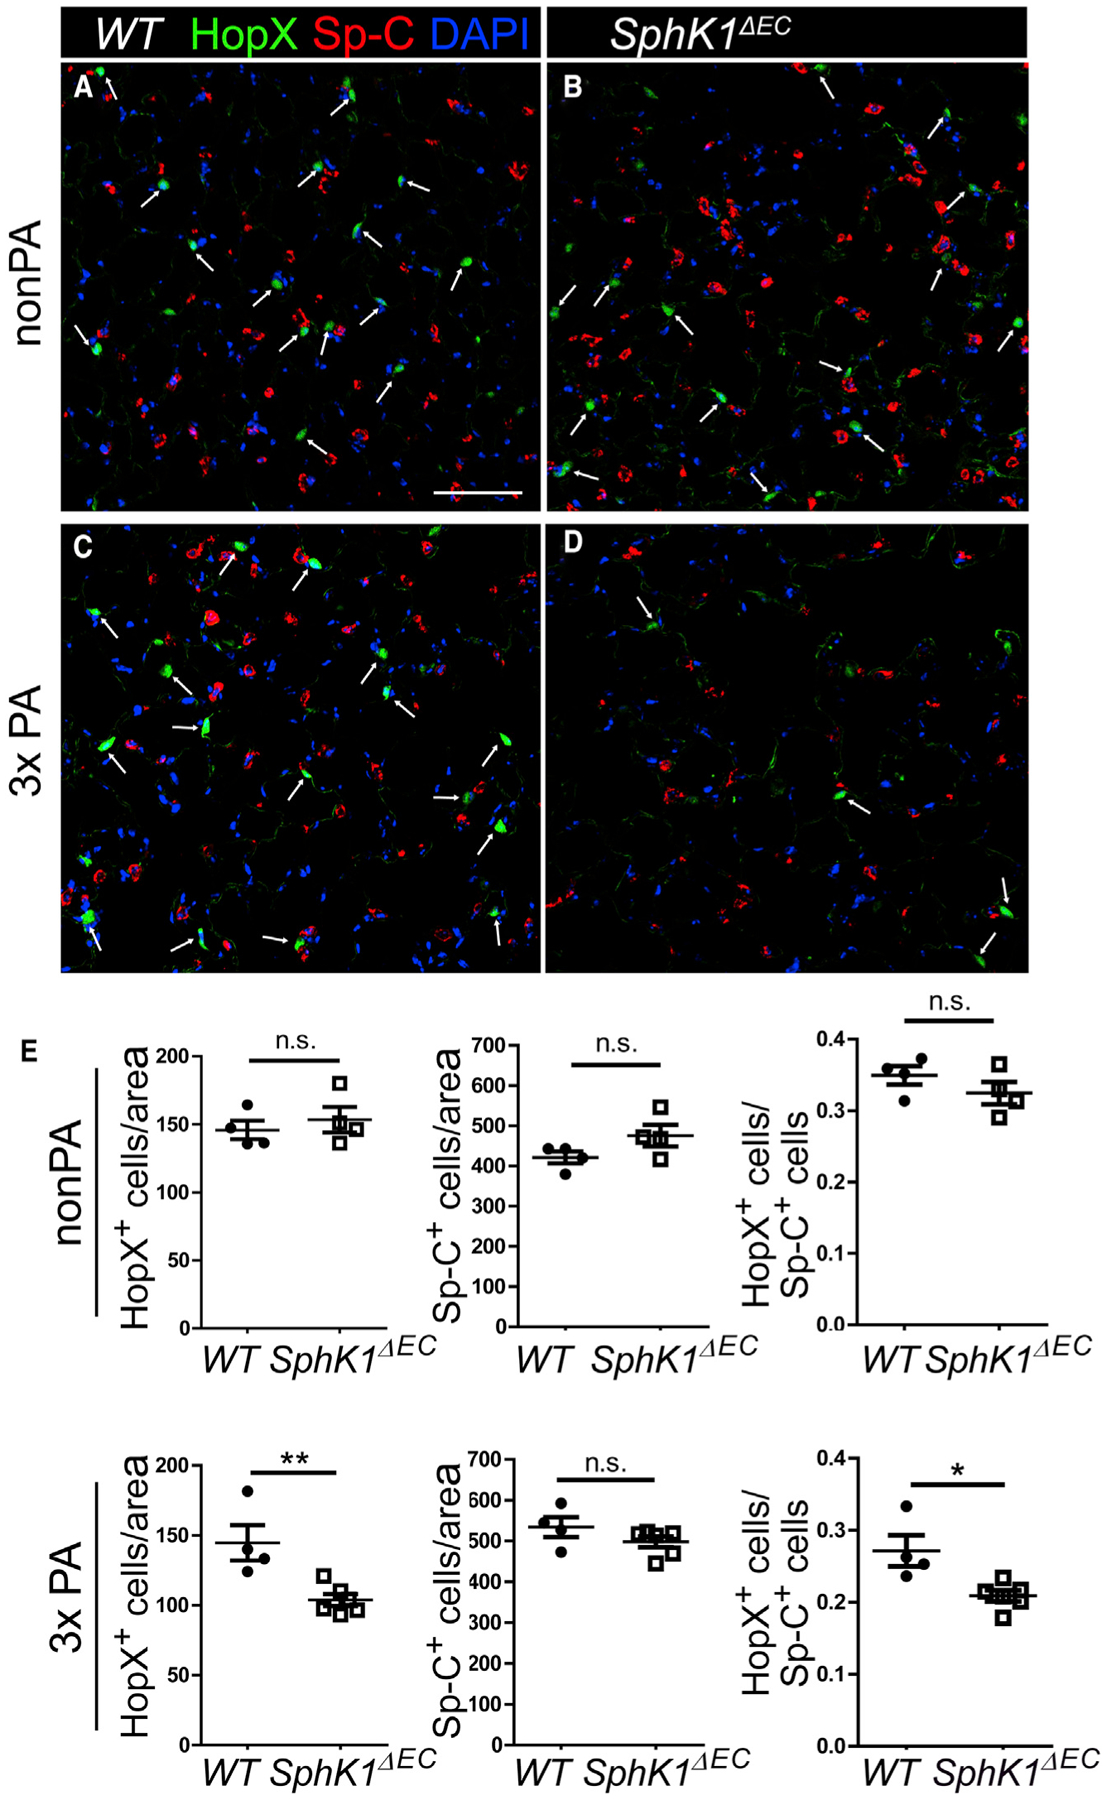
Figure 2. SphK1ΔEC Mice Had Fewer AT1 Cells Than WT after PA.

(A–D) Lung sections from uninjured or 33 PA injured WT and SphK1ΔEC mice were stained for Sp-C and HopX. Without injury (A and B), the numbers of HopX+ cells (arrow) were similar between WT (A) and SphK1ΔEC (B) lungs. After 3x PA injury (C and D), more HopX+ AT1 were present in WT (C) than SphK1ΔEC (D) lungs. Scale bar, 100 μm.
(E) The numbers of HopX+ and Sp-C+ cells were counted and normalized by area, and the ratios of HopX+ to Sp-C+ cells were calculated.
Mean ± SEM. *p < 0.05; **p < 0.01. n.s., not significant. See also Figures S2 and S3.
