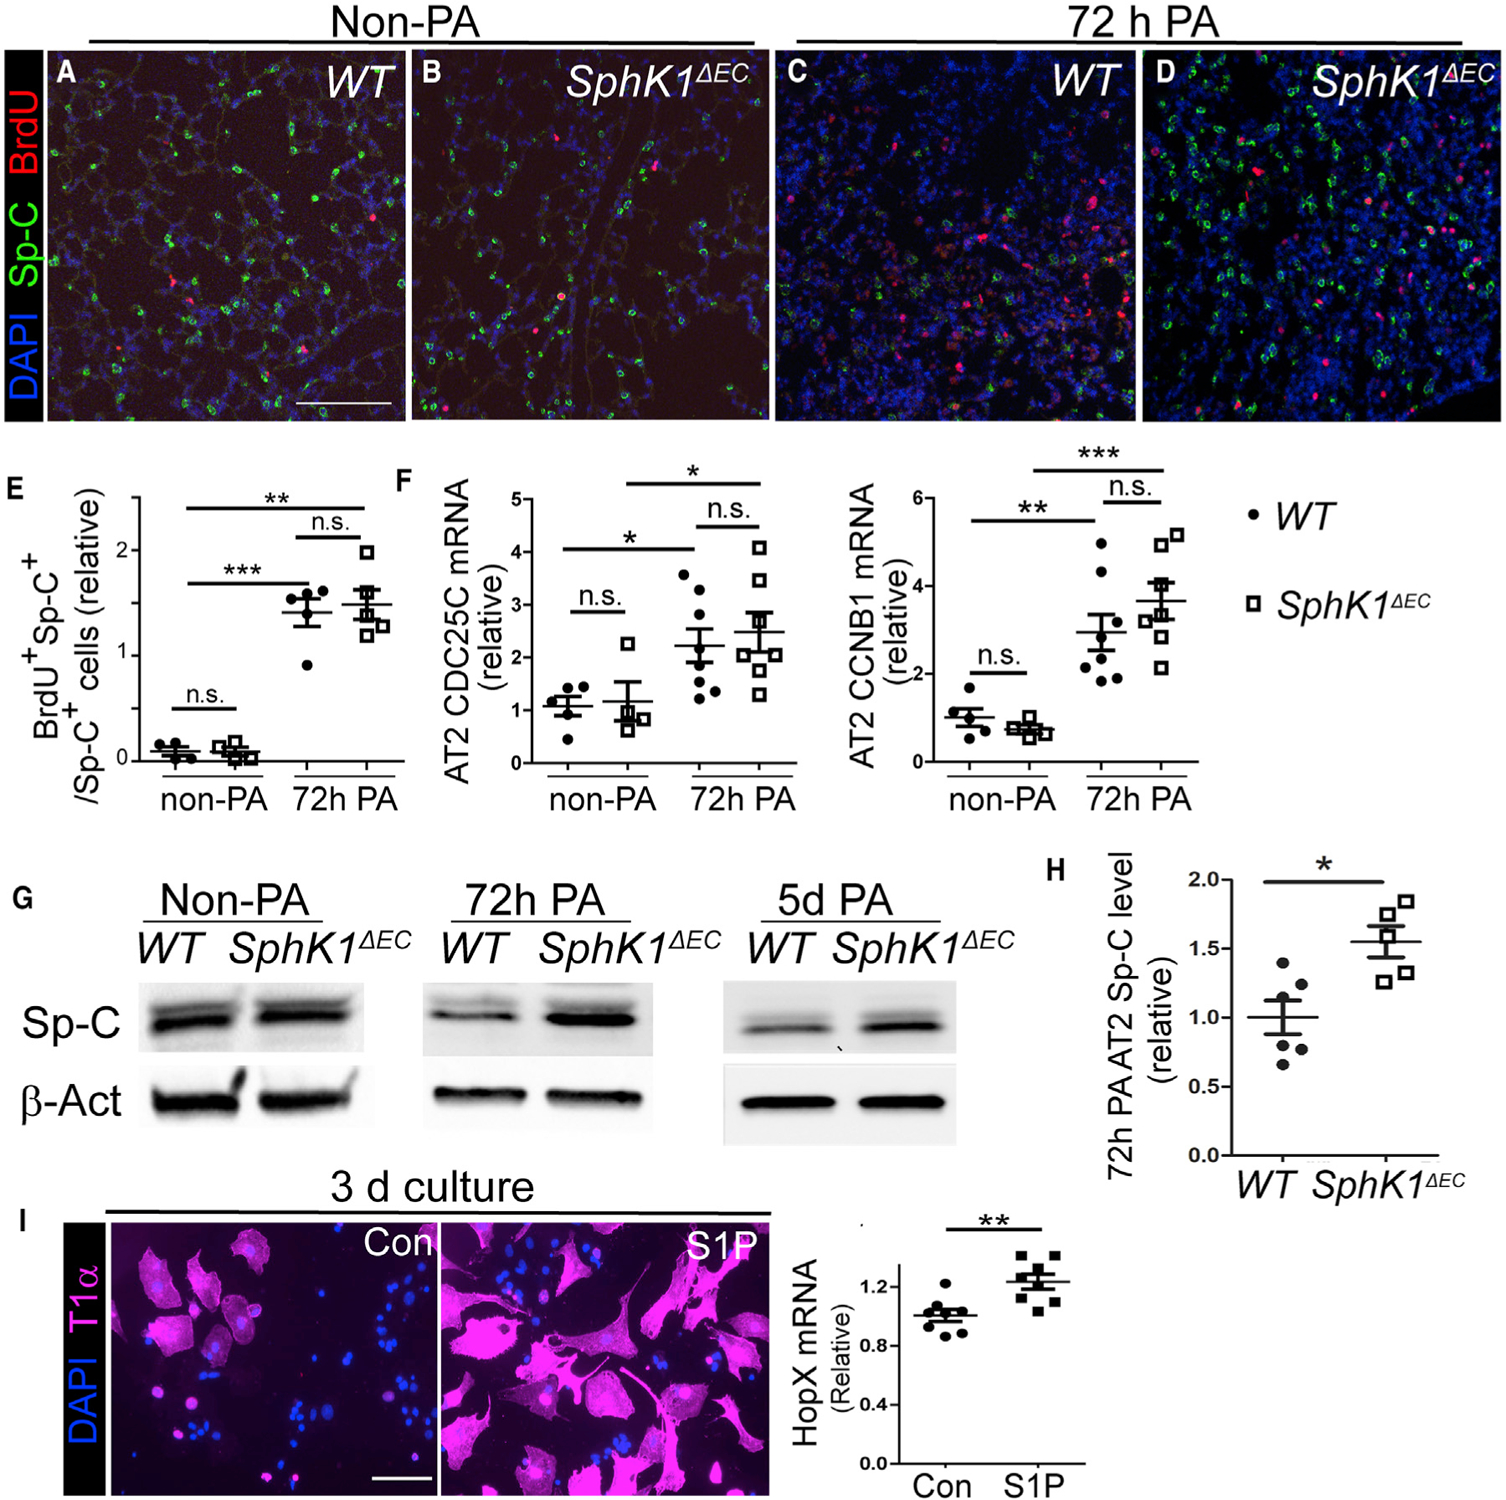
Figure 3. AT2 Cells Failed to Downregulate Sp-C Expression in SphK1ΔEC Mice after PA.

(A–D) Non-PA (A and B) and 72-h-post-PA (C and D) lung sections from WT (A and C) and SphK1ΔEC (B and D) mice were stained for Sp-C and BrdU. Images were taken randomly on non-PA lungs and at areas showing signs of pneumonia on injured lungs. Scale bar, 100 μm. Images are representative of 4–5 lungs for each genotype and condition. The number of Sp-C+BrdU+ cells were similar between WT and SphK1ΔEC without PA (A and B) or at 72-h-post-PA (C and D). In WT, Sp-C expression was reduced at 72-h-post-PA injury (C) compared with non-PA (A). Less reduction was detected in SphK1ΔEC comparing post PA (D) with non-PA (B).
(E) Percentage of BrdU+ AT2 cells that were quantified from lung sections stained with anti-BrdU and Sp-C antibodies.
(F) qPCR of CDC25C and CCNB1 expression in AT2 cells isolated from non-PA and 72-h-post-PA lungs of WT and SphK1ΔEC mice.
(G) AT2 cells were isolated from non-PA, 72-h-post-PA, and 5-day-post-PA lungs of WT and SphK1ΔEC mice and subjected to western blotting analysis for Sp-C.
(H) AT2 cell Sp-C levels normalized by b-actin were compared between WT and SphK1ΔEC at 72 h post-PA.
(I) Freshly isolated AT2 cells were cultured for 3 days and treated with 1 μM S1P or vehicle control. T1α expression in cells was assessed by immunostaining, and HopX expression was assessed by qPCR. Scale bar, 50 μm.
Mean ± SEM. *p < 0.05; **p < 0.01; ***p < 0.001; n.s., not significant. See also Figure S4.
