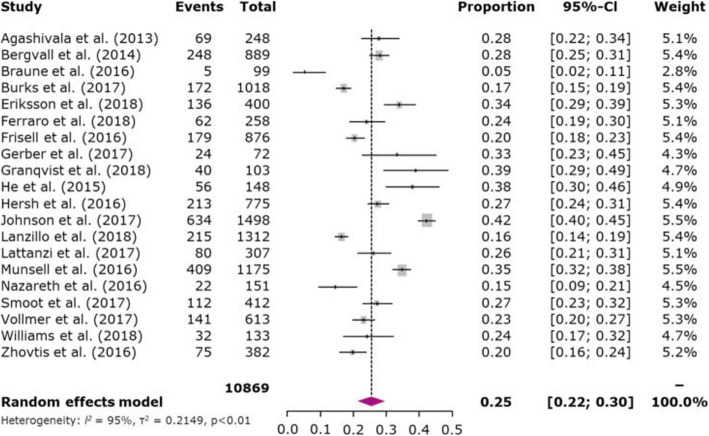
Fig. 4.
Meta-analysis of proportion of patients discontinuing a DMD. Note: For studies for which results for treatment-naive and treatment-experienced patients were reported separately (combined data were not available), data were combined; for studies reporting data for more than 1 oral DMD (combined data were not reported), data were combined; for studies reporting data for subgroups (combined data were not reported), data were combined; for Lattanzi et al., number of patients discontinuing at 12 months included patients for whom data were not available at 12 months because they stopped taking medications (n = 34); 34 + 46 = 80 of 307 or 26.05%; for Vollmer et al. and He et al., for which data were reported in Kaplan–Meier curves only, 1-year persistence rates were extracted from the curves using a digitizer (Guyot P et al. 2012); for Zhovtis et al. 2016, number of patients discontinuing at 12 months was derived from the reported 14-month rate (n = 76.4). The area of each grey square is proportional to the study’s weight in the meta-analysis. Weight values are rounded. Abbreviations: CI, confidence interval; DMD, disease-modifying drug

