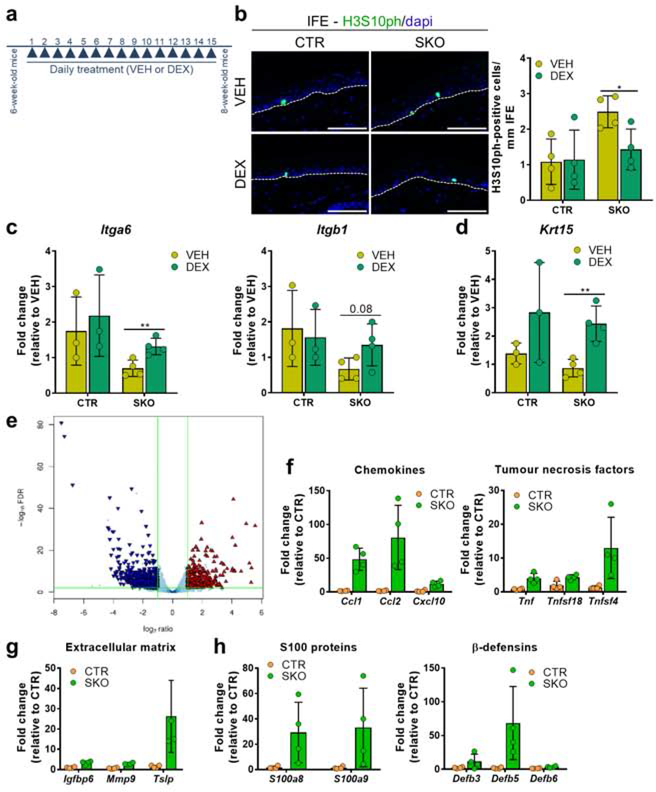
Figure 5. Contribution of chemokine-driven sterile inflammation to the SKO phenotype.
(a) Scheme for the treatment of CTRs and SKOs with vehicle (VEH) or dexamethasone (DEX). Skin samples were isolated 24h after the last treatment.
(b) Immunostaining of tail skin sections from vehicle/dexamethasone-treated CTRs and SKOs for H3S10ph. Bar diagrams show quantifications of H3S10ph immunostainings in the interfollicular epidermis (IFE; n=4). Scale bars, 75 μm.
(c,d) qRT-PCR analysis for the expression of the adherence markers Itga6 and Itgb1 (c) and the HFSC marker Krt15 (d) in vehicle/dexamethasone-treated skin samples.
(e) Volcano plot of differentially expressed genes between CTR and SKO mice of 8 weeks (n=4). The triangles are colored blue and red if they are classified as down- or upregulated genes, respectively, based on the corrected p-values (FDR<0.01, denoted by the horizontal green-colored line) and an absolute log2-ratio larger than 1 (denoted by the vertical green-colored lines.
(f-h) Bars charts of expression data of the indicated genes (FDR<0.01). The indicated genes belong to the families of chemokines and tumor necrosis factors (f), extracellular matrix proteins (g), or antimicrobial peptides (h). Data are expressed as a fold change ± SD (n=4) in the SKOs as compared to CTRs. The expression of all described genes (f-h) is significantly different between CTRs and SKOs based on the corrected p-value (FDR<0.01) of the RNA-seq analysis.
The bar data in b-d are represented as means ± SD (n≥3). *, p<0.05; **, p<0.01 (unpaired student’s t-test). The bar data in f-h are represented as means ± SD.

