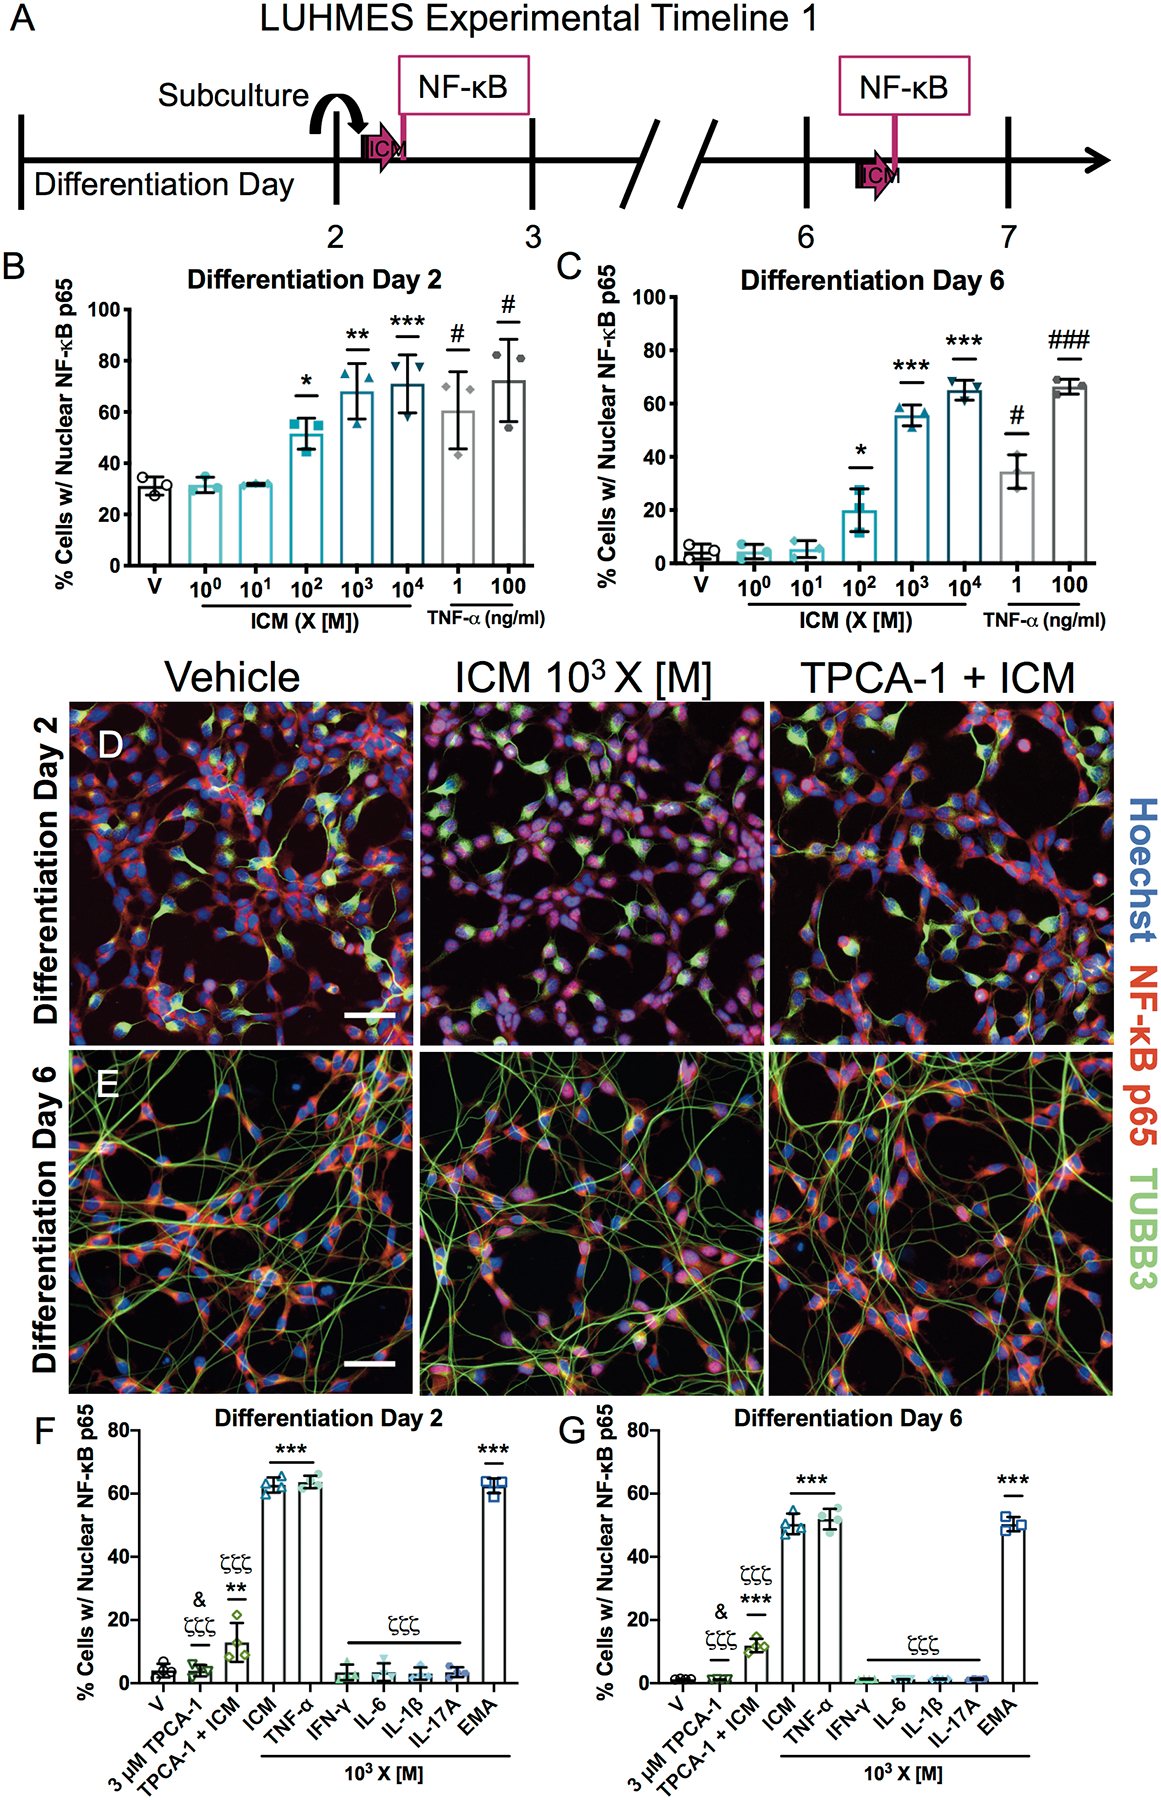
Figure 1. ICM exposure causes concentration-dependent NF-κB p65 activation in LUHMES cells.

A, LUHMES cells were exposed for 30 min on differentiation D2 or D6 to EMA cytokines, individual or as the ICM or EMA mix at varying concentrations relative to those identified in maternal serum [M]. B-C, Quantitative analyses of nuclear NF-κB staining in LUHMES cells on D2 (B) and D6 (C). TNF-α was used as a positive control. D-E, Representative photomicrographs of LUHMES cells on D2 (D) and D6 (E) exposed to vehicle, ICM at 103 X [M] ± 3 μM TPCA-1. Activated NF-κB (red) translocated to the nucleus (blue) appears pink. β-III Tubulin (TUBB3, green) identifies neuronal processes. Bar=50 μm. F-G, Quantitative analyses of nuclear NF-κB staining on D2 (F) and D6 (G) following exposure to ICM or EMA mix at 103 X [M], individual cytokines at 103 X [M], or TPCA-1 at 3 μM ± ICM. Data presented as mean ± SD (n=3 (B-C) or 4 (F-G, except for EMA group in G, n=3) independent experiments with 4–8 replicate wells per condition per experiment). *p<0.05, **p<0.001, ***p<0.0001 vs. vehicle (V) and ζζζp<0.0001 vs. ICM by one-way ANOVA with post hoc Dunnett’s multiple comparisons test; #p<0.05, ###p<0.0001 vs. vehicle by unpaired t test; &p<0.05 TPCA-1 vs. TPCA-1+ICM by unpaired t test (with Welch’s correction in G).
