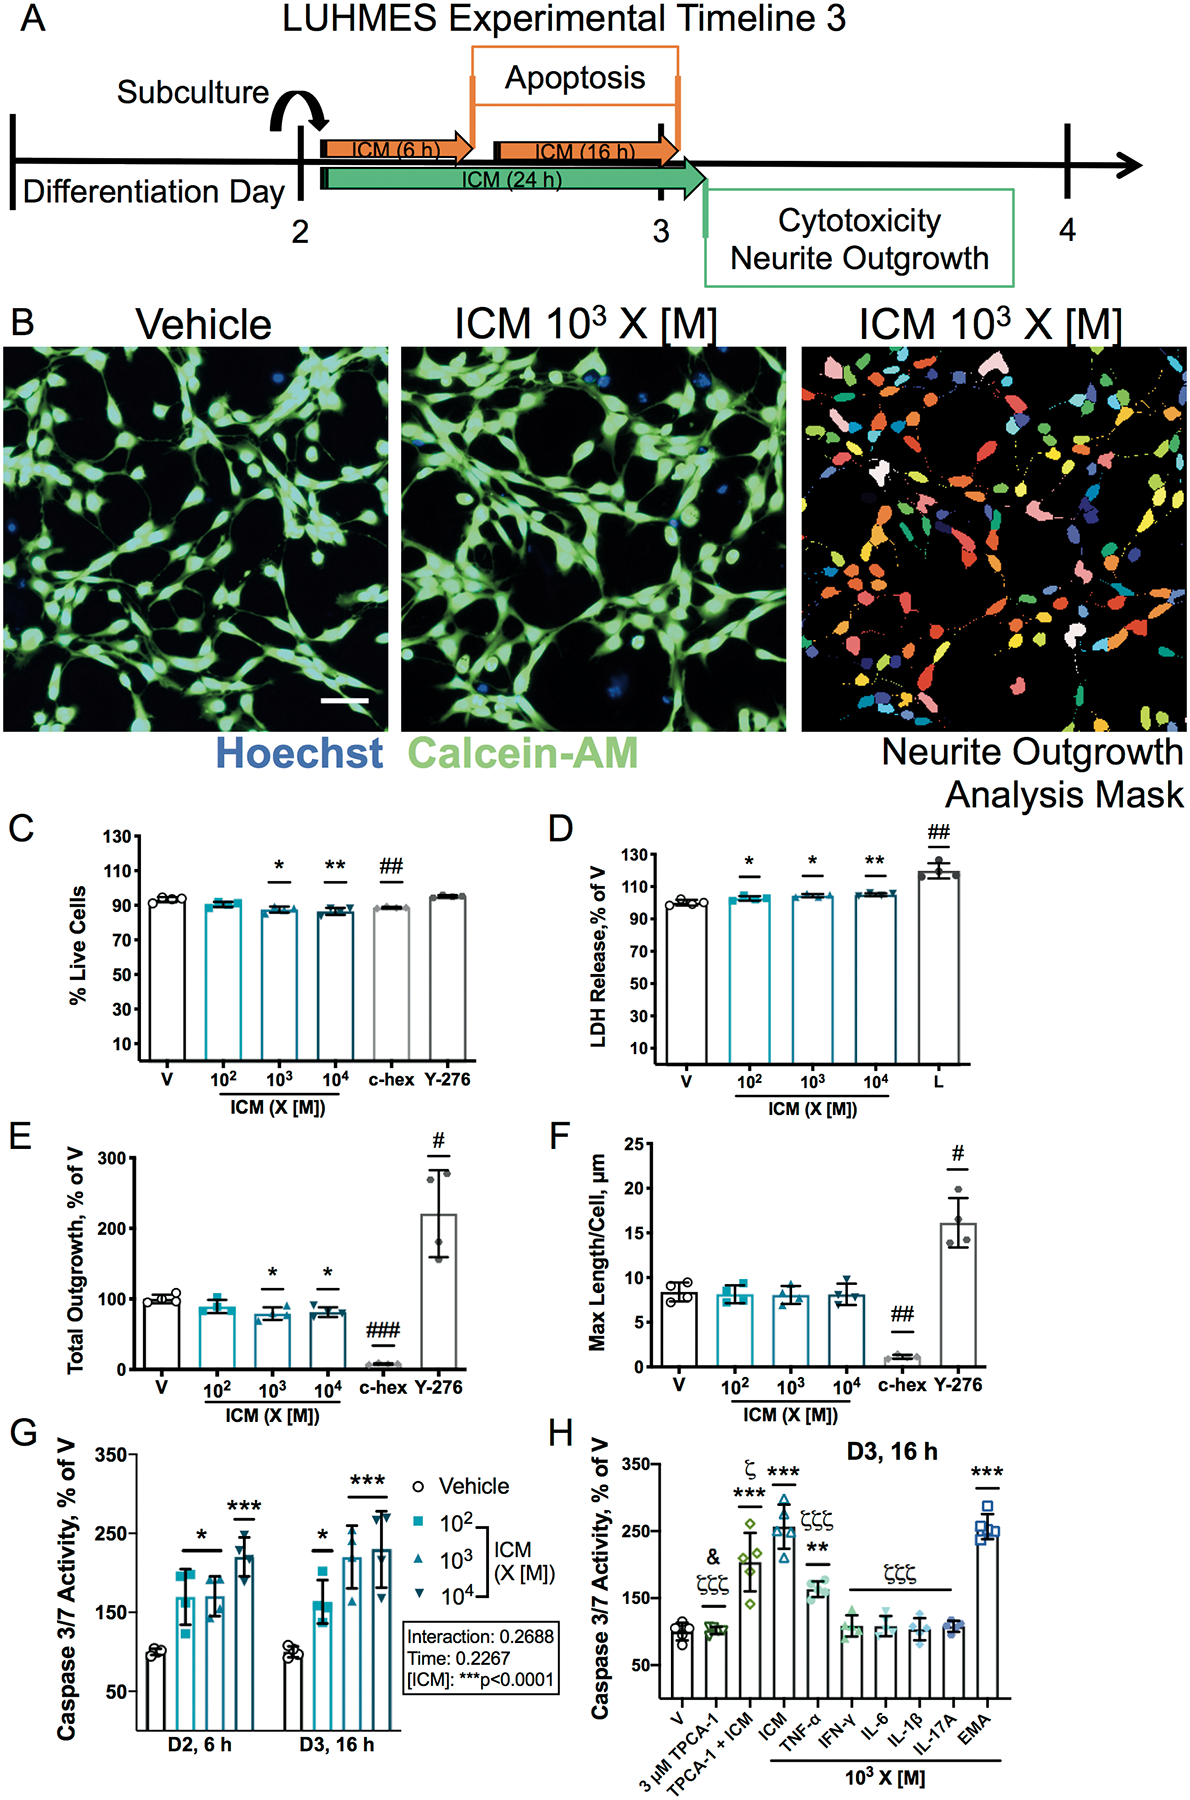
Figure 3. ICM decreases neurite outgrowth and increases apoptosis on D3.

A, On D2, LUHMES cells were exposed to ICM at 102-104 times [M] starting 1 h after subculturing. After 24 h, conditioned media was collected for a membrane integrity assay and cells stained with a viability dye were imaged. Caspase-3/7 activity was measured at 6 h and 16 h post-exposure. For neurite outgrowth experiments, cycloheximide (c-hex, 3 μM) was used as a control to decrease neurite outgrowth, and Y-27632 (Y-276, 10 μM) as a control to increase neurite outgrowth (Supplementary Figure 9A). B, Representative photomicrographs of D3 LUHMES cells co-stained with the nuclear dye Hoechst (blue) and calcein-AM (green) to visualize neurite outgrowth in live cells; mask used for automated analysis of neurite outgrowth in individual neurons using MetaXpress software shown on right. Bar=50 μm. Cell viability was measured as C, percentage of cells stained with calcein-AM and D, LDH release, normalized to vehicle, with lysis buffer (L, 9% Triton-X 100) as the positive control. E-F, Effects of ICM on neurite outgrowth measured as E, total neurite outgrowth (percent of vehicle) and F, maximum process length per cell. G-H, Quantification of caspase-3/7 activity in D2 and D3 LUHMES cells exposed for 6 or 16 h, respectively, to ICM, EMA mix, individual cytokines, or 3 μM TPCA-1 ± ICM, normalized to vehicle. Data shown as mean ± SD (n=4 (C-G) or 5 (H) independent experiments with 12–24 (C-F) or 4–6 (G-H) replicate wells each). C-F, H, *p<0.05, **p<0.001, ***p<0.0001 vs. vehicle as determined by one-way ANOVA; G, *p<0.05, ***p<0.0001 vs. vehicle as determined by 2-way ANOVA; H, ζp<0.05, ζζζp<0.0001 vs. ICM by one-way ANOVA; specific group differences identified by post hoc Dunnett’s multiple comparisons test. C-F, #p<0.05, ##p<0.001, ###p<0.0001 vs. vehicle as determined by unpaired t test; H, &p<0.01 for TPCA-1 vs. TPCA-1 + ICM by unpaired t test with Welch’s correction.
