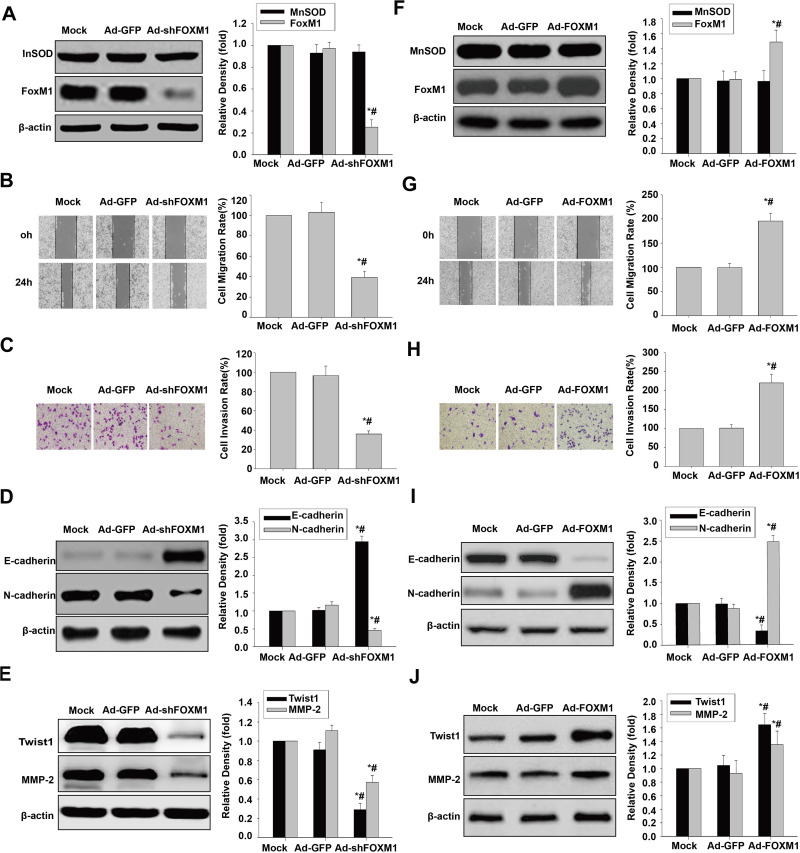
Figure 5.
Effects of FoxM1 silencing and overexpression on migration, invasion and the EMT phenotype. MnSOD and FoxM1 protein levels (A), cell migratory and invasive capacities (B and C), and E-cadherin, N-cadherin, Twist1 and MMP-2 protein amounts (D and E) in HCSLCs transfected with Ad-GFP or Ad-shFoxM1 (n=3; *P<0.05 vs Mock; #P<0.05 vs Ad-GFP;one-way ANOVA) are shown. MnSOD and FoxM1 protein levels (F), cell migratory and invasive capacities (G and H), and E-cadherin, N-cadherin, Twist1 and MMP-2 protein amounts (I and J) in MHCC97H cells transfected with Ad-GFP or Ad-FoxM1 (n=3; *P<0.05 vs Mock; #P<0.05 vs Ad-GFP; one-way ANOVA) are shown.

