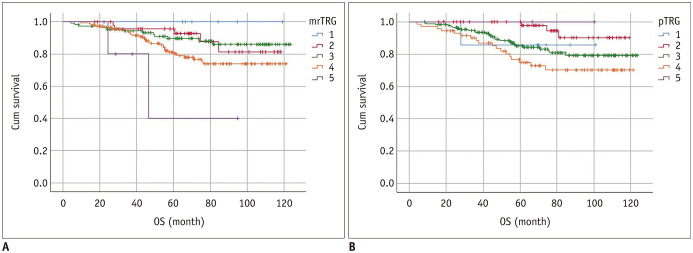
Fig. 6. OS curves according to TRG on MRI (A) and pathology (B) based on 5-point grading system.
OS rate was significantly different among mrTRG groups (p = 0.024) and pTRG groups (p = 0.038). Specifically, 5-year survival rate was 100% for mrTRG 1, 92.7% for mrTRG 2, 89.6% for mrTRG 3, 80.1% for mrTRG 4, and 40.0% for mrTRG 5. However, it was 85.7% for pTRG 1, 97.8% for pTRG 2, 84.3% for pTRG 3, 74.9% for pTRG 4, and 100% for pTRG 5. Cum survival = cumulative survival, OS = overall survival

