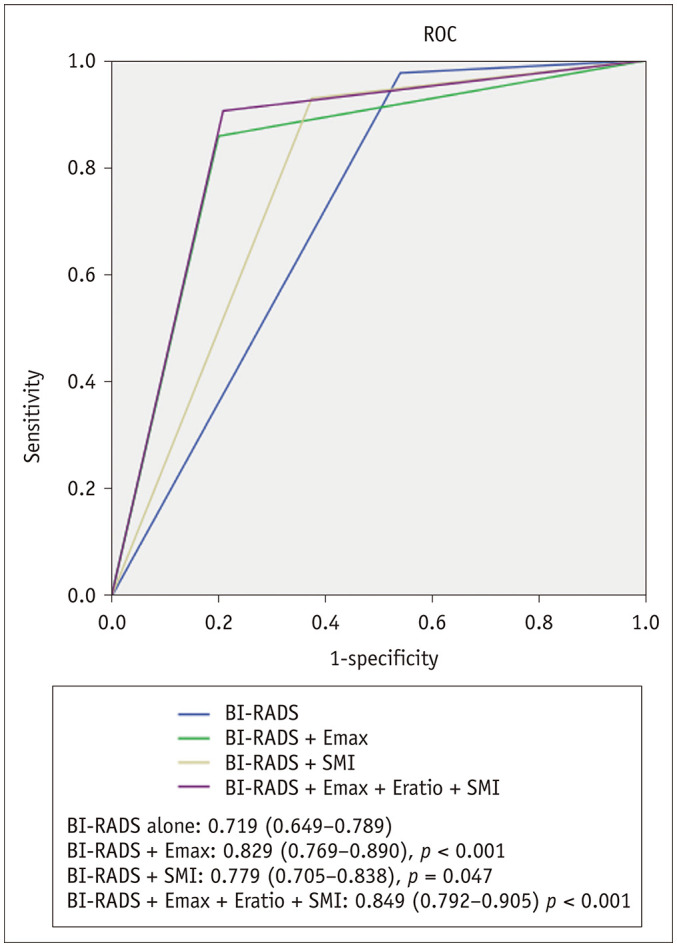
Fig. 2. ROC curve for BI-RADS alone and combined with quantitative parameters for set 1.

AUC were significantly different between BI-RADS alone for all combined quantitative parameters (Emax + Eratio + SMIVI) and Emax (p < 0.001). All combined quantitative parameters with BI-RADS had highest AUC values (0.849), (95% confidence interval, 0.792–0.905). AUC = area under ROC curve, ROC = receiver operating characteristic
