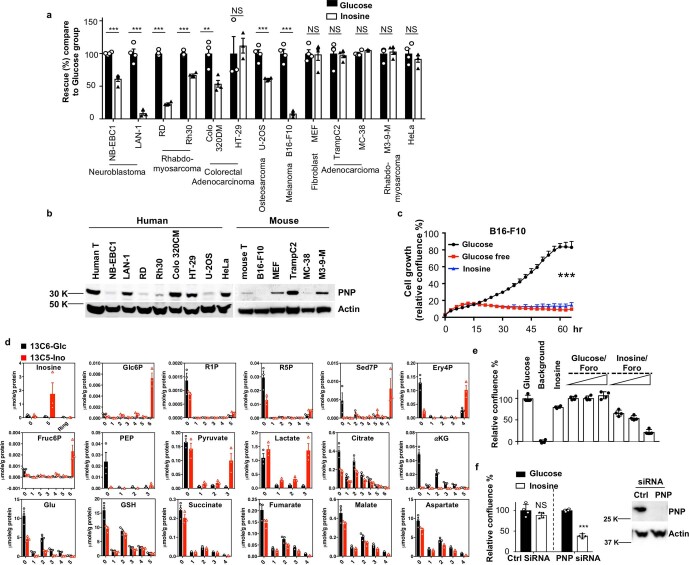
Extended Data Fig. 8. Transformed cells display diverse capacity to utilize inosine as a carbon source.
a, The indicated cell lines were cultured without glucose (background), with glucose or with inosine, and cell growth curves were monitored by live cell imaging analysis (IncuCyte ZOOM™). Cell confluences of the indicated cell lines cultured with glucose at 72-96 h were set to 100%. Data are presented as mean ± SD (n=4). **, P<0.01 and ***, P<0.001 for Glucose versus Inosine. P=0.00009, 0.0001, 0.0000001, 0.00001, 0.0042, 0.6917, 0.0006, 0.00001, 0.9059, 0.7962, 0.0796, 0.6663, 0.3829 from left to right, respectively. b, The expressions of PNP in indicated cell lines were determined by immunoblot. c, B16-F10 cells were cultured in the indicated conditional media and cell growth curves were monitored and analyzed by IncuCyte ZOOM™. Data are presented as mean ± SD (n=4). ***, P<0.001 for 2 mM Glucose versus 2 mM Inosine. Data are representative of three independent experiments. d, Quantification of indicated metabolites in HeLa cells. All abbreviations are as described in Fig. 2. Values represent mean ± SEM (n=3). e, HeLa cells were incubated without glucose (background), with glucose or with inosine, as well as in combination with increased concentrations of Foro (0.1 μM, 0.5 μM, and 2 μM), and cell growth was monitored by live cell imaging analysis (IncuCyte ZOOM™). The confluences of HeLa cells cultured with glucose at 60 h were set to 100%. Data are presented as mean ± SD (n=4). f, HeLa cells were transfected with scrambled siRNA or PNP siRNA for 3 days. Cells were then switched to glucose-free (background), glucose-containing, or inosine-containing media and cell confluence was determined by live cell imaging analysis (IncuCyte ZOOM™). The confluences of HeLa cells in the presence of glucose at 96 h were set to 100%. Error bars represent standard deviation from mean of quadruplicate samples (left). NS, P=0.2022; ***, P=0.0000006 for Glucose versus Inosine. PNP protein expression levels were determined by immunoblot (right). Data are representative of two independent experiments (b, e, f). Data were analyzed by unpaired two-sided t-test (a, c, f). Sample size (n) represents biologically independent samples (a–f).

