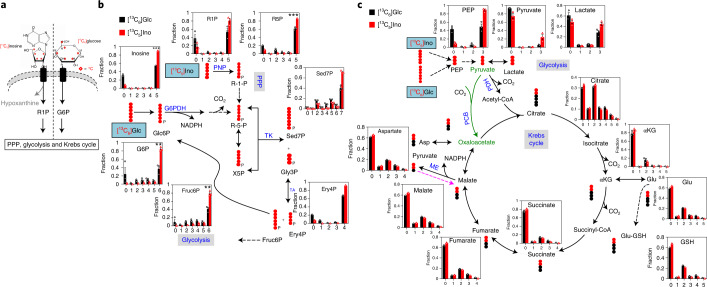
Fig. 2. The ribose subunit of inosine can replace glucose and feed into the central carbon metabolism in Teff cells.
a, Diagram of [13C5]inosine and [13C6]glucose uptake and conversion to R1P or G6P, respectively, which subsequently enters downstream metabolic pathways: the PPP, glycolysis and the Krebs cycle. The red diamond denotes uniformly 13C-labelled positions of the ribose subunit of inosine and all carbons of glucose. b,c, Active human T cells were incubated in [13C6]glucose (Glc) or [13C5]ribose-inosine (Ino) medium for 24 h, were extracted as described in the Methods and were analysed for PPP metabolites (b) and glycolytic/Krebs cycle metabolites (c) by IC–UHR-FTMS. Data are presented as mean ± s.e.m. (n = 3). **P = 0.0028, 0.0021; ***P = 6 × 10⁻⁷, 0.0003, for [13C6]G6P, [13C6]Fruc6P, [13C5]Inosine and [13C5]R5P for [13C6]glucose versus [13C5]inosine, respectively, by unpaired two-sided t-test. X5P, xylulose-5-phosphate; Gly3P, glyceraldehyde-3-phosphate; G6PDH, glucose-6-phosphate dehydrogenase; Glu-GSH, glutamyl unit of glutathione; PCB, pyruvate carboxylase; ME, malic enzyme; TK, transketolase; TA, transaldolase; black dot, 12C; red dot, 13C derived either from the PDH- or PCB-initiated Krebs cycle reactions, or from the reverse ME reaction. Solid and dashed arrows represent single- and multi-step reactions, and single and double-headed arrows refer to irreversible and reversible reactions, respectively. Numbers on the x axes represent the numbers of 13C atoms in the given metabolites. Sample size (n) represents biologically independent samples (b,c). Green text and arrows represent metabolite names and routes in a branched pathway; purple arrows represent a reverse reaction; black text represents metabolite names; blue text represents the names of metabolic enzymes and metabolic pathways.

