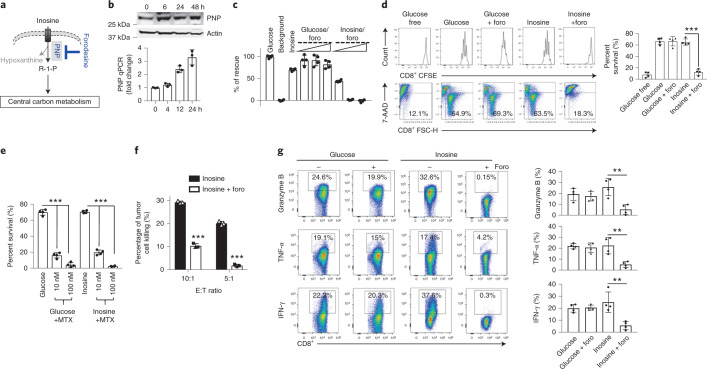
Fig. 3. PNP is required for inosine-dependent proliferation and effector functions of mouse Teff cells.
a, Diagram of the PNP inhibitor foro blocking the breakdown of inosine into hypoxanthine and R1P. b, PNP protein and messenger RNA expression levels in mouse T cells at the indicated time points following activation were determined by immunoblot (top) and quantitative PCR (bottom), respectively. Data are representative of two independent experiments. c, Bar graph representing mouse T-cell bioenergetic activity in the indicated conditioned media. Activated mouse T cells were incubated without glucose (background), with glucose or with inosine, as well as with glucose or inosine in combination with increased concentrations of foro (0.1 μM, 0.5 μM and 2 μM) for 24 h, followed by Biolog redox dye mix MB incubation, and were measured spectrophotometrically at 590 nm. d, Bar graph representing cell-survival percentages in the indicated condidioned media. Naive CD8+ cells from C57BL/6 mice were activated as previously described in complete medium for 24 h, and then the cells were switched to the indicated conditioned media in combination with 2 μM foro for 72 h. Cell proliferation and cell death were determined by CFSE dilution (top) and 7-AAD uptake (bottom), respectively. ***P = 0.000009 for inosine versus inosine + foro. e, Naive CD8+ T cells from C57BL/6 mice were activated and cultured in the presence of glucose or inosine and were treated with MTX for 72 h. Cell death was determined by 7-AAD uptake. ***P = 5.68 × 10⁻⁷, 1.23 × 10⁻⁷, 1.07 × 10⁻⁷ and 3.19 × 10⁻¹⁰, from left to right. f, B16 melanoma cells were co-cultured with activated Pmel+ T cells generated in the presence of inosine with or without foro, and the percentage of tumour-cell lysis was determined by calcein release. ***P = 0.000008 and 0.000007 for E:T ratios 10:1 and 5:1, respectively. g, Naive CD8+ T cells from C57BL/6 mice were activated as previously described and differentiated in the indicated conditioned media with or without 2 μM foro for 4 d. The indicated proteins were quantified by intracellular staining following PMA and ionomycin stimulation. Data are presented as mean ± s.d. (n = 3 for b,f; n = 4 for c–e,g). **P = 0.0042, 0.0048 and 0.0056 for granzyme B, TNF-α and IFN-γ for inosine versus inosine + foro. Data were analysed by unpaired two-sided t-test (d–g). Sample size (n) represents biologically independent samples (b–g).

