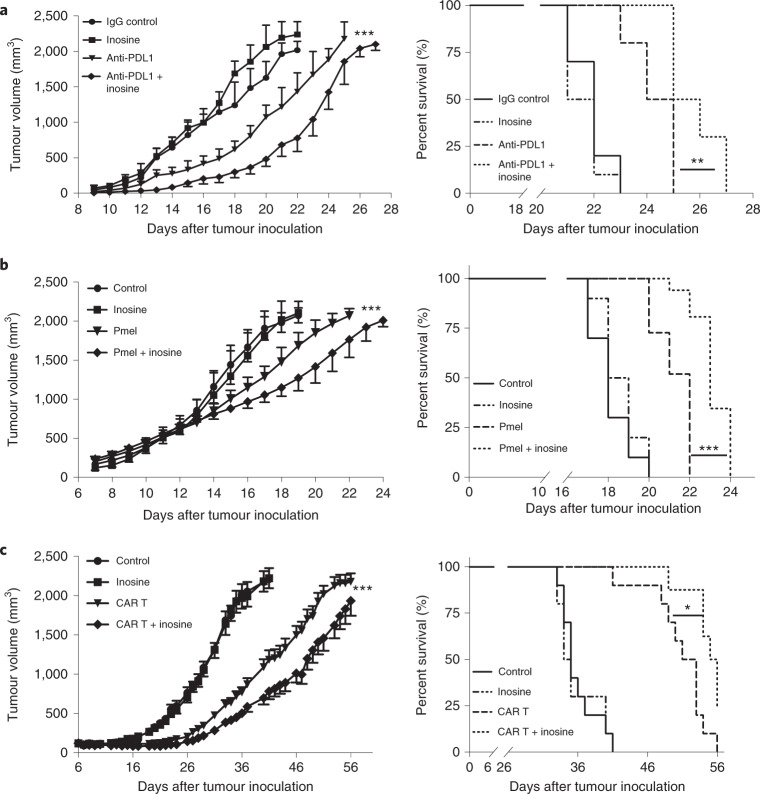
Fig. 6. Inosine supplementation enhances immunotherapy in targeting solid tumours that are defective in metabolizing inosine.
a, A murine melanoma xenograft model was established in C57BL/6 mice by subcutaneous inoculation of B16-F10 tumour cells. The indicated experimental mice were treated with IgG control (200 μg, intraperitoneal (i.p.) injection twice per week), inosine (300 mg per kg (body weight), oral gavage daily), anti-PDL1 antibody (200 μg, i.p. twice per week) or anti-PDL1 antibody (200 μg, i.p. twice per week) + inosine (300 mg per kg (body weight), oral gavage daily). Tumour size and mouse survival were monitored. Data represent mean ± s.d. (n = 10). ***P < 0.0001 for anti-PDL1 versus anti-PDL1 + inosine, by two-way ANOVA (left). **P = 0.0018 for anti-PDL1 versus anti-PDL1 + inosine (right), by one-sided Mantel–Cox test. b, C57BL/6 mice were injected (subcutaneously) with B16-F10 melanoma cells and were sublethally irradiated (500 cGy) at day 6 after tumour-cell inoculation. One day later, mice were i.v. injected with activated Pmel CD8+ T cells (4 × 10⁶ cells per mouse). Mice were administered inosine (300 mg per kg (body weight) per day by oral gavage from day 8). Tumour size and mouse survival were monitored. Data are presented as mean ± s.d. (n = 10). ***P = 0.0091 for Pmel versus Pmel + inosine, by two-way ANOVA (left). **P < 0.0001 for Pmel versus Pmel + inosine with one-sided Mantel–Cox test (right). c, A human neuroblastoma xenograft model was established in NSG mice by subcutaneous inoculation of LAN-1 neuroblastoma cells. The indicated experimental mice were treated, from day 6 when tumours reached 100–150 mm3, with PBS (i.v. as control), inosine (300 mg per kg (body weight) by oral gavage daily), GD2-CAR T cells (8 × 10⁶ cells per mouse, i.v.) and GD2-CAR T cells (8 × 10⁶ cells per mouse, i.v.) + inosine (300 mg per kg (body weight) by oral gavage daily). Tumour growth and mouse survival were monitored. Data are presented as mean ± s.e.m. (n = 20 for control and inosine, 19 for CAR T and 16 for CAR T + inosine group). ***P < 0.0001 for CAR T versus CAR T + inosine with two-way ANOVA (left). *P = 0.0111 for CAR T versus CAR T + inosine with one-sided Mantel–Cox test (right). Data are representative of two independent experiments (a–c). Sample size (n) represents biologically independent animals (a,b) or tumours (c).

