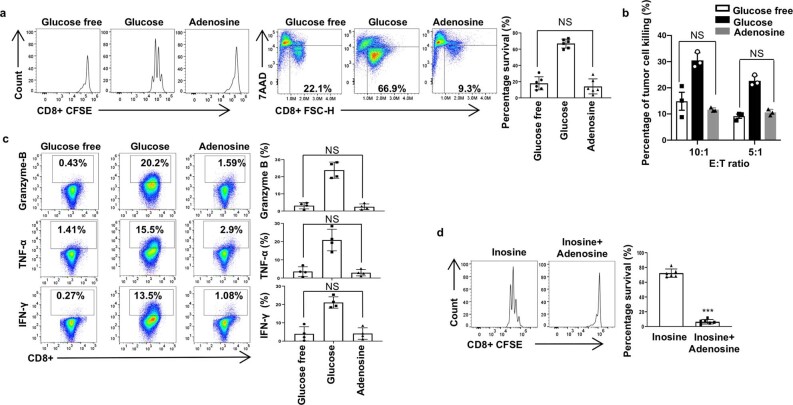
Extended Data Fig. 2. Adenosine cannot support mouse T effector cell proliferation and function in the absence of glucose.
a, Naive CD8+ T cells from C57BL/6 mice were activated by plate-bound anti-CD3 and anti-CD28 antibodies in the indicated conditional media for 3 days. Cell proliferation and cell death of active CD8+ T cells were determined by CFSE dilution and 7AAD uptake, respectively. Data are presented as mean ± SD (n=6). NS, P=0.4668 for Glucose free versus Adenosine. b, B16 melanoma cells were co-cultured with activated Pmel T cell that are generated in complete media followed by 72 h incubation in the indicated conditional media and the percentage of tumor cell lysis was determined by calcein release with the Spectramax M2 microplate reader. Data are presented as mean ± SD (n=4). NS, P=0.4107 and 0.2385 for E:T ratio 10:1 and 5:1 for Glucose free versus Adenosine, respectively. c, Naive CD8+ T cells from C57BL/6 mice were activated by plate bound anti-CD3 and anti-CD28 antibodies and differentiated in the indicated conditional media for 4 days. The indicated proteins were quantified by intracellular staining following PMA and ionomycin stimulation. Data are presented as mean ± SD (n=4). NS, P=0.6305, 0.6906, 0.9495 for Granzyme B, TNF-α, and IFN-γ for Glucose free versus Adenosine, respectively. d, Naive CD8+ T cells from C57BL/6 mice were activated in the indicated conditional media for 3 days. Cell proliferation and cell death of active CD8+ T cells were determined by CFSE dilution and 7AAD uptake, respectively. Data are presented as mean ± SD (n=6). ***, P=2E-10 for Inosine versus Inosine+Adenosine. Data were analyzed by unpaired two-sided t-test (a–d). Sample size (n) represents biologically independent samples (a-d).

