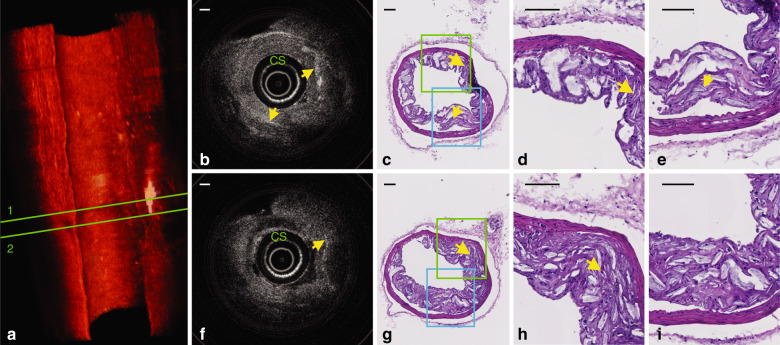
Fig. 6. In situ OCT imaging in an atherosclerotic mouse aorta.
a Three-dimensional rendering of the volumetric data set acquired with a 3D printed intravascular imaging catheter in a diseased mouse artery. The volume comprises 258 frames of OCT images. A video of this 3D rendering is available as Supplementary Movie 2. This rendering reveals distributions of cholesterol crystals, which are indicated by white. b Cross-sectional OCT image of region 1 in a; c corresponding hematoxylin and eosin (H&E) histology image; d zoomed green region in c; e zoomed blue region in c. f Cross-sectional OCT image of region 2 in a; g corresponding H&E histology image; h zoomed green dashed region in g; i zoomed blue dashed region in g. Yellow arrows point to cholesterol crystals; CS: catheter sheath. Scale bar: 100 µm

