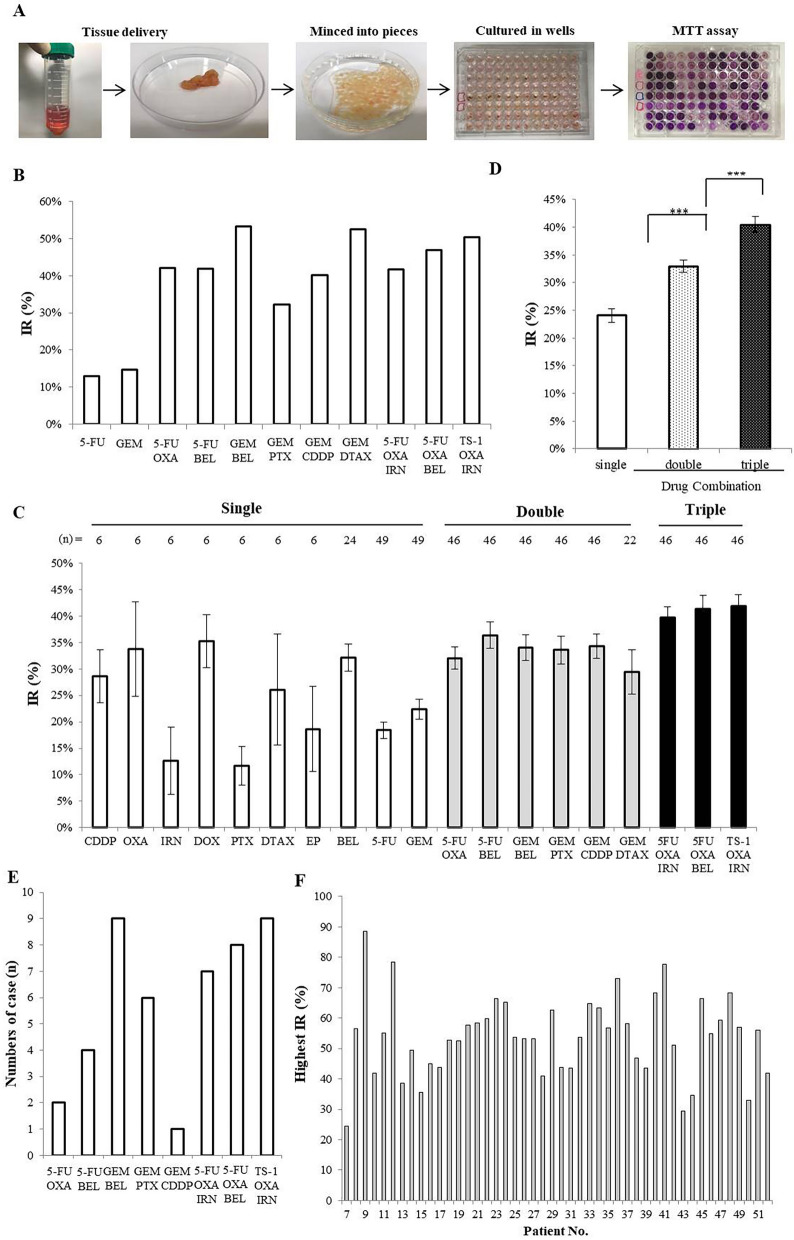
Figure 1.
Comparison of inhibitory rates (IRs) of single and combination drug regimens. (A) The patient's tissue was excised, divided into fragments, and placed in culture medium, treated with drugs and tested with the MTT assay. Cell viability with various drugs was determined in the HDRA. (B) Example HDRA results from patient 27. (C) Comparison of IR average values for each drug regimen. (D) Comparison of IRs between single drug and combination regimens (Kruskal–Wallis test, *** p < 0.001). (E) The number of drug combinations with the highest IR among the cases tested in the HDRA. Compared to other regimens, GEM/DTAX was excluded due to the small number of assays. (F) Summary of the highest IR values for each patient. Results from patients 7 to 52 with combination regimens.

