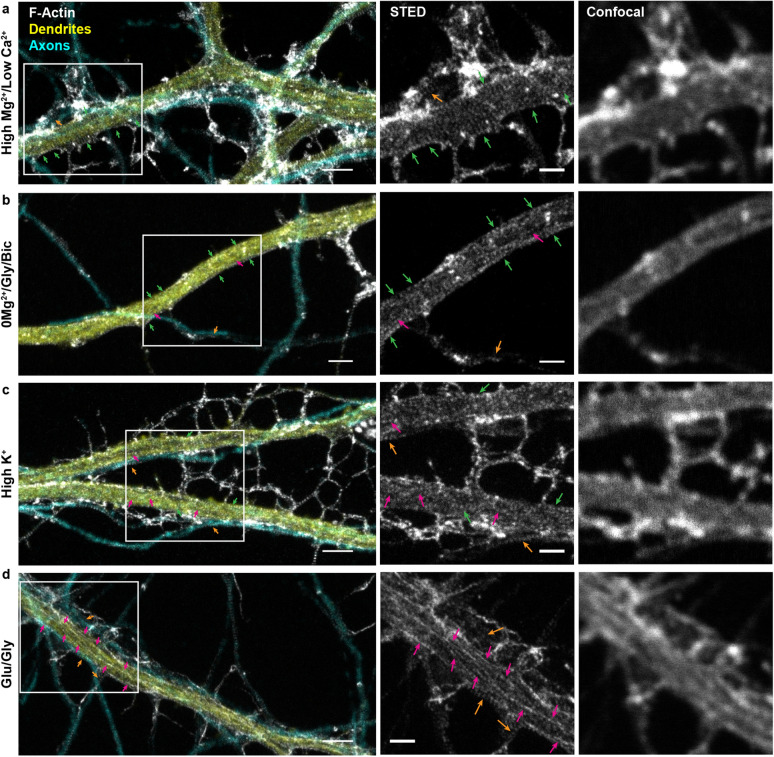
Figure 2.
Nanoscale activity-dependent remodelling of F-actin revealed by STED nanoscopy. Three color imaging of F-actin (STED, white), phosphorylated neurofilaments (confocal, cyan) and MAP2 (confocal, yellow) was performed to identify F-actin nanostructures in dendrites (yellow) and axons (cyan). STED imaging shows that the prevalence of dendritic rings (green arrows) and longitudinal fibers (magenta arrows) is modulated by neuronal activity, while axonal rings (orange arrows) are observed regardless of the activity level. Shown are example images for (a) the activity-reducing stimuli high /low and the three activity-promoting stimuli (b) 0/glycine/bicuculline (0/Gly/Bic), (c) high , and (d) glutamate/glycine (Glu/Gly). Insets (right) show a magnification of the regions identified with a white rectangle on the left STED images. Scale bar left: 2 m, insets: 1 m. For the raw images without overlay see Supplementary Fig. 3.

