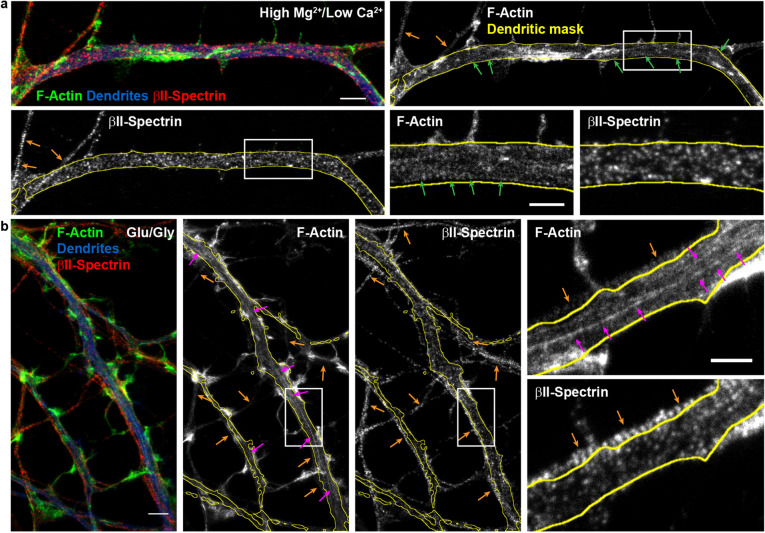
Figure 3.
Two-color STED nanoscopy of F-actin and II-spectrin in dendrites. (a) Low-activity high /low condition and (b) Glutamate/Glycine neuronal stimulation. (a) Top-Left and (b) Left: Overlay of two-color STED nanoscopy of F-actin (green) and II-spectrin (red) with confocal imaging of MAP2 (blue) to identify the dendrites. Insets show the magnified regions identified in the full single-color STED images of F-actin and II-spectrin. Arrows indicate the detected F-actin and II-spectrin patterns: dendritic rings (green), axonal rings (orange), and longitudinal fibers (magenta). Scale bars (a, b) 2 m, insets .

