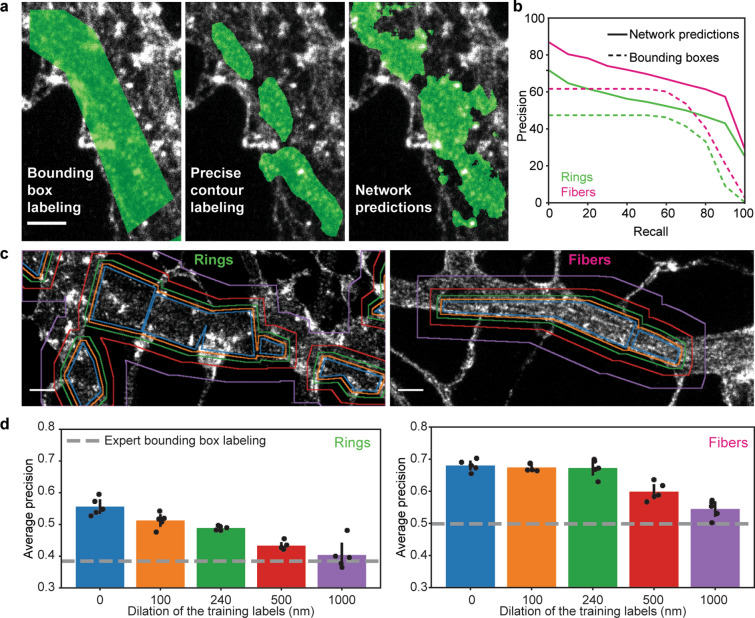
Figure 5.
Performance evaluation of the FCN in the context of weakly supervised learning and labeling errors. (a) Comparison between manual bounding box (left), precise contour (middle) and FCN predicted (right) labeling of the dendritic F-actin ring pattern (For the raw image without overlay see Supplementary Fig. 8). (b) Precision-recall curves for F-actin rings (green) and longitudinal fibers (magenta). The area under the curve, or average precision (AP), was calculated for both patterns. The network achieved an AP score of 0.53 and 0.67 for F-actin rings and fibers, respectively, compared to 0.38 and 0.5 for the manual bounding box labeling (using the precise contour labeling as the ground truth). The higher performance observed for the predictions compared to the bounding box labeling shows that the network is able to infer precise segmentation rules using only coarse examples. (c) Generation of a training dataset to characterize the impact of coarse labeling on the precision of by stepwise dilation (original labels—blue, 100 nm—orange, 240 nm—green, 500 nm—red, 1 m—violet) of the training labels for F-actin rings (left) and fibers (right). (d) The AP scores were calculated for 5 different instances of the network for each dilation step. For F-actin fibers (right) dilation up to 1 m still resulted in network predictions with significantly higher precision than manual bounding box labeling (post-hoc t test, , , , , ). For the F-actin ring patterns, a dilation of 1 m led to an AP score comparable to the expert labeling (post-hoc t test, ), while smaller dilation steps led to significantly higher AP scores compared to bounding box labeling (post-hoc t test, , , , ). Black lines represent the 95% confidence interval calculated from the t-statistics distribution. Scale bars .

