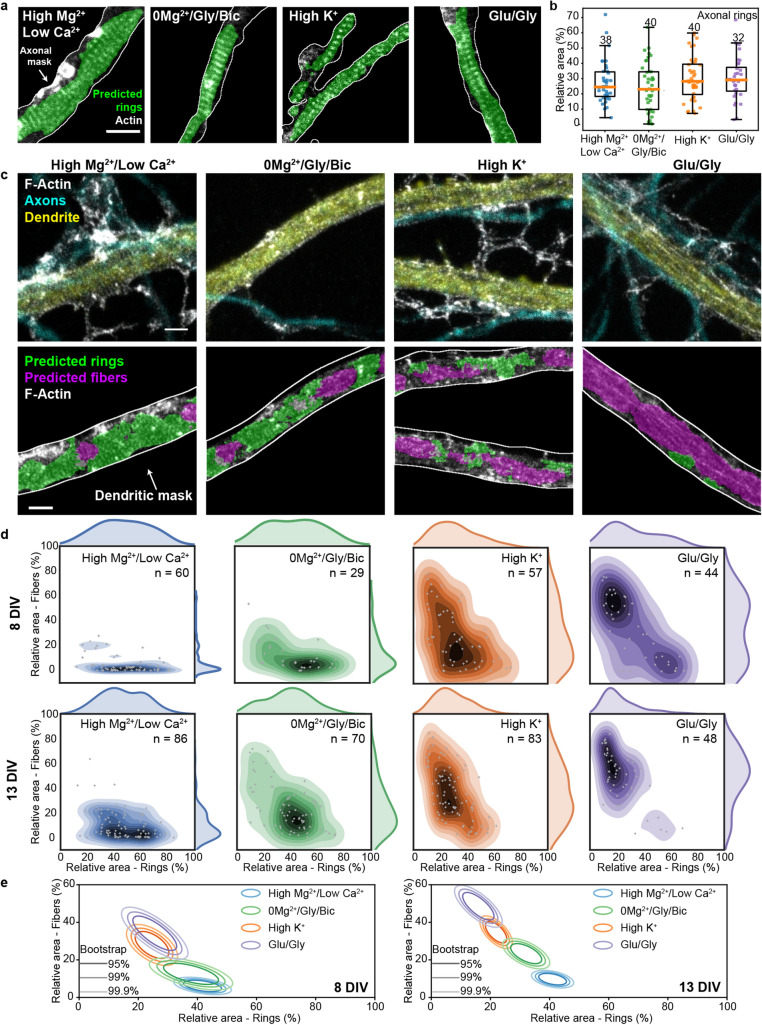
Figure 6.
Increasing neuronal activity induces the reorganization of F-actin rings into longitudinal fibers in dendrites but not in axons. (a) Representative images of the periodical F-actin rings in axons of neurons exposed to 4 different treatments modulating neuronal activity. The area of F-actin rings segmented by the FCN is shown in green. (b) The detected area for axonal rings in 13 DIV neurons remains unchanged upon stimulation (one-sided ANOVA, , numbers above each boxes indicate the number of neurons from 4 independent cultures). (c) Representative images of the periodical F-actin lattice and the longitudinal fibers in dendrites of 13 DIV neurons for four different treatments modulating neuronal activity: Top STED Images of F-actin stained with Phalloidin-STAR635 overlayed with the confocal images of the dendritic (MAP2, yellow) and axonal (phosphorylated neurofilaments, cyan) makers. Bottom: Predictions of the FCN for F-actin rings (green) and fibers (magenta) inside the dendritic mask (white line). (d) Bivariate kernel density estimate of the raw data (grey cross) for 8 DIV and 13 DIV neurons treated with (i) high /low for 10 min (blue), (ii) 0/Gly/Bic for 10 min (green), (iii) high for 2 min (orange) and iv) Glu/Gly for 2 min (violet). (e) Mean distributions using bootstrapping. The formation of F-actin fibers is enhanced for 13 DIV neurons compared to 8 DIV neurons for the synaptic stimulation 0/Gly/Bic or Glu/Gly, but not for high stimulations. Shown are the regions comprising 95%, 99% and 99.9% of the data point distribution. Scale bars 1 m. d,e) Number of independent cultures (N): high /low ; 0/Gly/Bic ; high ; Glu/Gly . Note that the detected areas for dendrite and axons cannot be compared since the detection of F-actin rings was performed with two different FCNs and using different foreground masks. Only a comparison between the stimulation conditions for each experiment (dendrites or axons) is possible. Scale bars 1 m. For the raw image without overlay see Supplementary Fig. 10.

