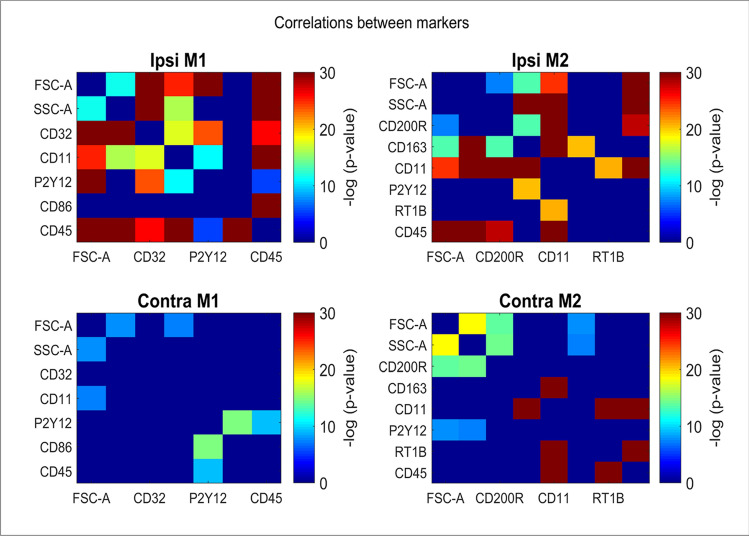
Figure 6.
Assessment of Correlations between Markers. Heat maps presentation gathers the Cohen’s q [Cohen J. Statistical power analysis for the behavioral sciences] of the differences between the Pearson correlation coefficients between different activation markers across the registered events in the injured ipsilateral, contralateral relative to the same correlations in sham cells. Cold colors (green to blue) imply on non-correlative relationship between each couple of markers, while warm colors (yellow to red) represent increasing levels of correlation between each couple of markers. More correlations are observed in the ipsilateral compared to its contralateral hemisphere.

