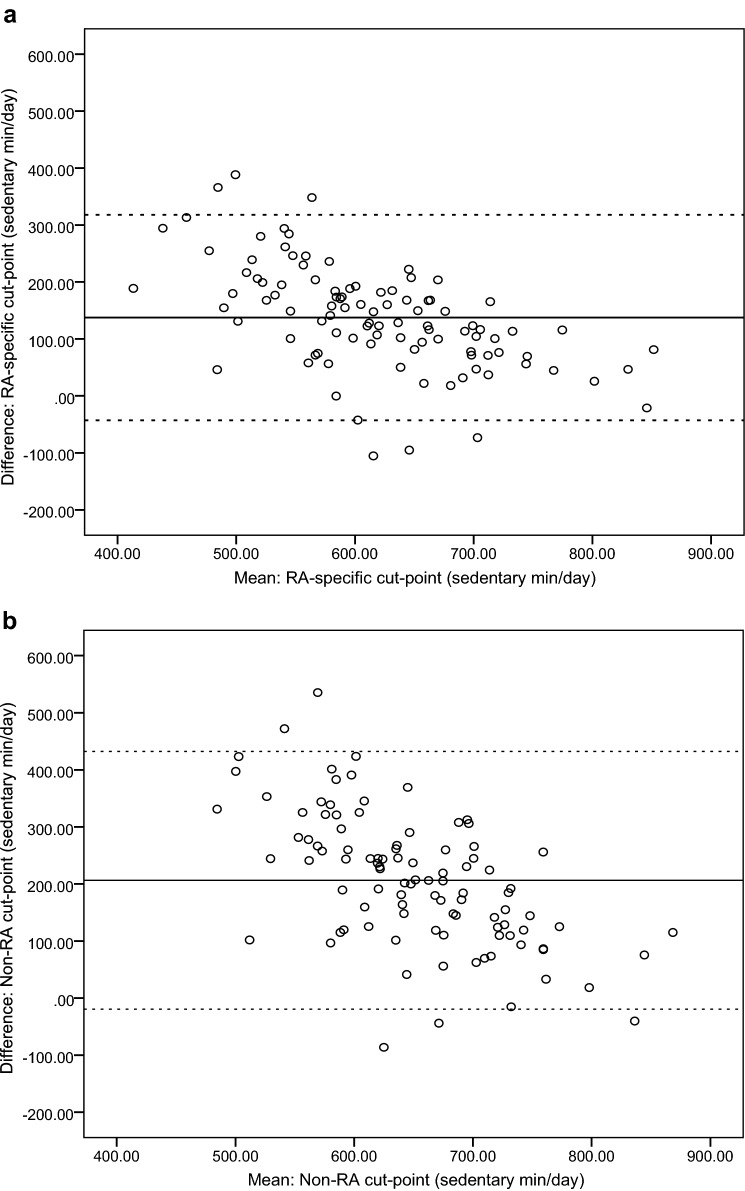
Fig. 2.
Objective 2: Bland–Altman plots showing agreement (mean difference and limits of agreement [LOA]) between GT3X+-assessed vs. activPAL3μ™-assessed sedentary time. Accelerometer count-based cut-points applied were: RA-specific (VM) count-based cut-points [≤ 244 count/min, derived from objective 1 of this study (a)], and non-RA (Y-axis) count-based cut-points [< 100 counts/min (b)]. Note: Straight full line represents mean difference and the straight dotted line represents lower and upper LOA (95%)

