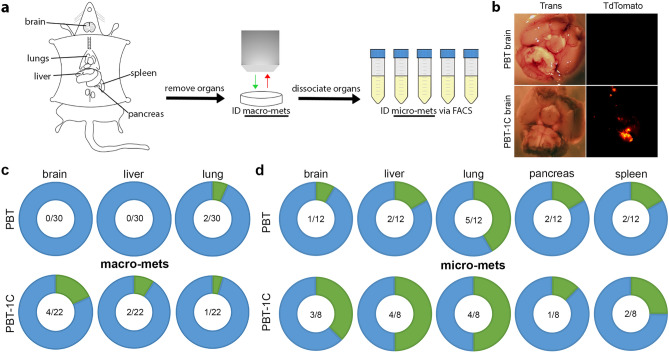
Figure 2.
Loss of Coronin 1C in melanoma results in more distant metastases. (a) Schematic diagram of macro- and micro-metastasis identification in mouse models. Organs are removed and macro-metastases are identified with a stereo microscope via TdTomato signal. Organs are then dissociated to a single cell suspension and micro-metastases are identified by FACS sorting. (b) Example of a macro-metastasis identified in a PBT-1C mouse brain 13 weeks after induction. For comparison is a PBT brain with no visible metastases 19 weeks after induction. (c) Donut plots displaying the number of mice with identified macro-metastases in green compared to the number of mice screened with no visible metastases present in blue for each organ in both PBT and PBT-1C mice. The fractions in the middle represent the number of organs with macro-metastases over the total number of organs screened. (d) Donut plots displaying micro-metastases for the brain, liver, lung, pancreas, and spleen for both GEM models as described in (c).

