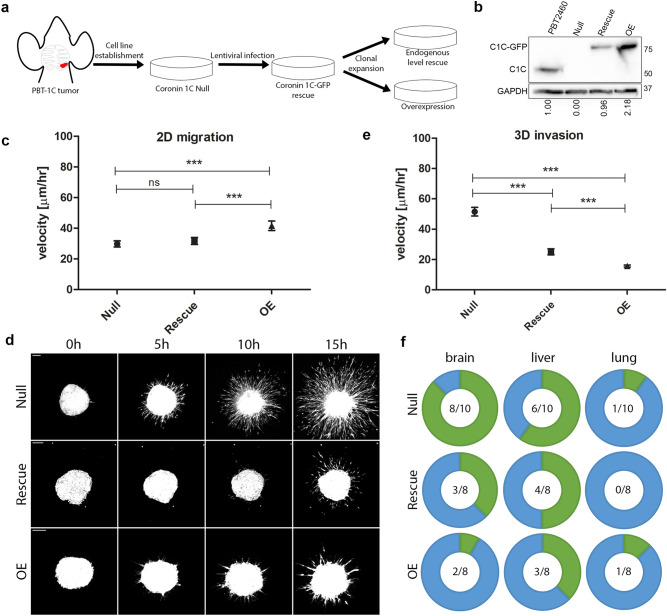
Figure 3.
Cells lacking Coronin 1C are more invasive than their Coronin 1C-expressing counterparts. (a) A Coronin 1C-null cell line (Null) was isolated from a PBT-1C brain metastasis and infected with lentiviral Coronin 1C-GFP. This rescue line underwent clonal expansion to create one line with endogenous levels of Coronin 1C (Rescue) and one line with overexpressed Coronin 1C (OE). (b) Western blot of the Null, Rescue, and OE cell lines compared to PBT2460, a cell line isolated from a Pten/Braf melanoma tumor with endogenous Coronin 1C. Blot is cropped between C1C (Coronin 1C) and GAPDH to conserve space. An uncropped blot for each protein can be found in Suppl. Fig. 7. (c) Mean velocities +/− 5% CI of single Null, Rescue and OE cells migrating on 10 µg/mL fibronectin-coated glass. Null cell N = 81, Rescue cell N = 115, OE cell N = 99. Total of 3 biological replicates for each cell line. (d) Representative maximum intensity projection movie stills from Null, Rescue, and OE cell spheroids embedded in 3D collagen over 15 h after embedding. Scale bars = 100 µm. (e) Quantification of the mean velocities + /- 95% CI measured from individual cells invading the matrix around the main spheroid mass outlined in (d). Null cell N = 123, Rescue cell N = 88, OE cell N = 191. 3 biological replicates for each cell line. (f) Donut plots displaying the number of nude mice with identified micro-metastases in green compared to those with no detectable metastasis in blue for the brain, liver, and lung dissected from nude mice injected with spheroids of Null, Rescue and OE cells after primary tumor ulceration. The fractions in the middle represent the number of organs with micro-metastases over the total number of organs screened. *** = P < 0.001.

