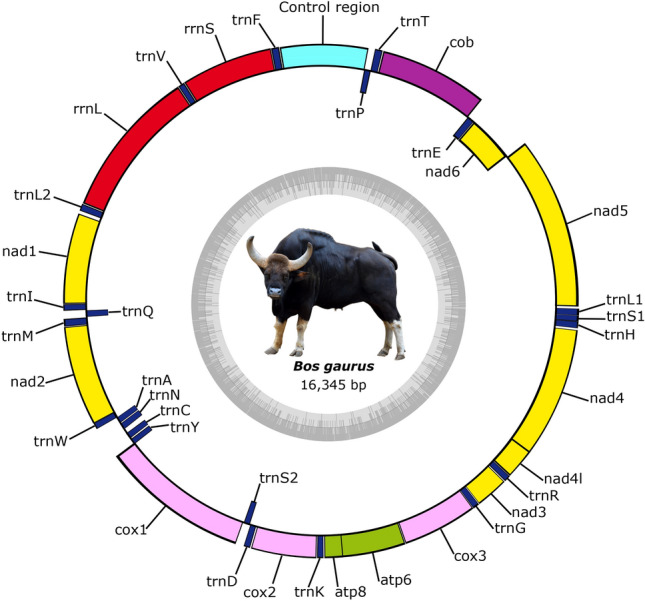
Figure 1.

The mitochondrial genome map of Indian gaur. The colored blocks outside the circle denote 28 genes encoded on the H-strand and the colored blocks inside the circle denote the remaining 9 genes encoded on the L-strand. The total GC content of the mitochondrial genome is represented by an inner ring. The mitochondrial genome map was generated using the web server OGDRAW25. The Indian gaur photograph was taken by the fourth author Dhandapani Sureshgopi. The final figure was edited manually in Inkscape 1.0. (https://inkscape.org).
