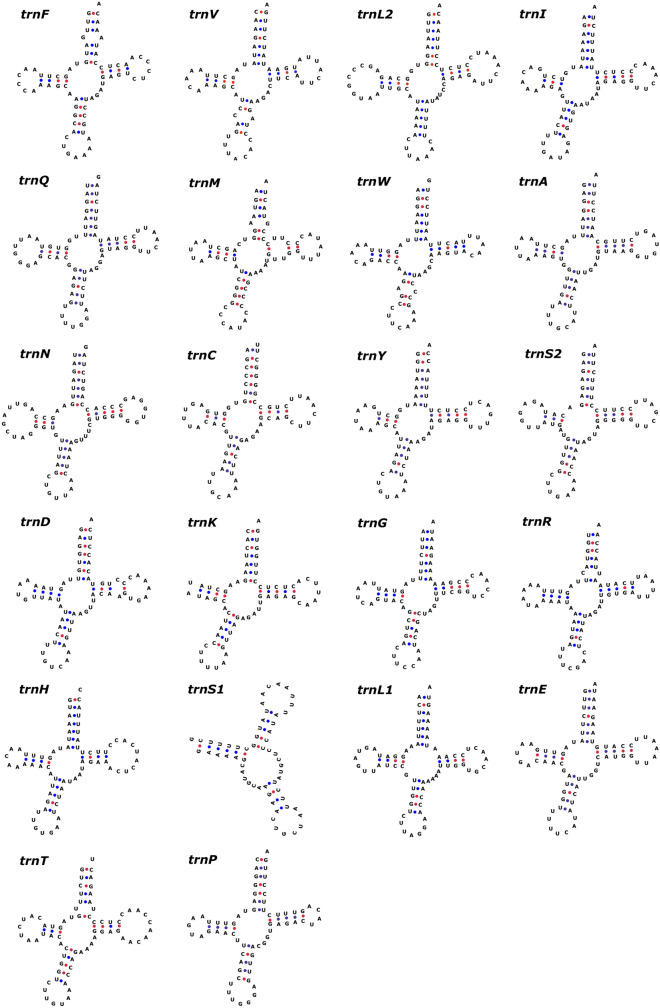
Figure 4.
The predicted secondary structures of 22 typical tRNA genes of Indian gaur. Base pairing between G and C is represented by red dots whereas base pairing between A and U is represented by blue dots. Of the four gaur samples three had anticodon GAA for trnF while the sample GR01 had anticodon AAA for trnF and no other structural difference was observed between the samples. The tRNA structures were generated using the web server tRNAscan-SE26 and edited in Inkscape 1.0. (https://inkscape.org).

