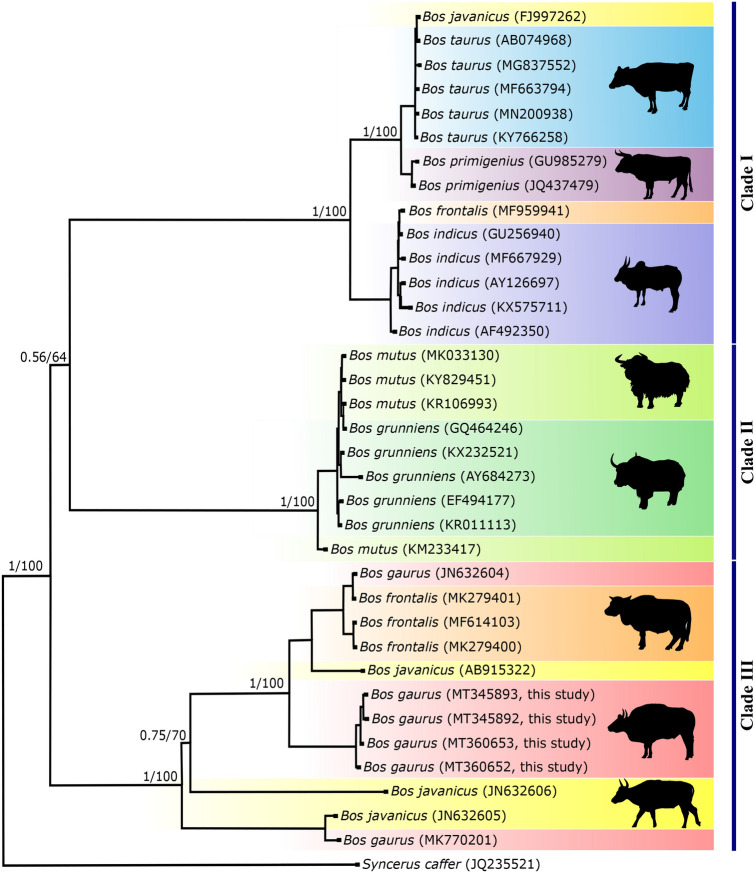
Figure 5.
Phylogenetic relationship of Bos species inferred from whole mitochondrial genome. Bayesian and maximum parsimony trees were constructed using 16,345 bp sequences of eight Bos species. The Syncerus caffer mitochondrial genome sequence was used as an out-group. Numbers adjacent to the nodes represent Bayesian posterior probability and bootstrap values. Mitochondrial genome sequences except Indian gaur sequences were retrieved from GenBank and their accession numbers are given in parentheses. The tree was generated using the softwares MEGA27and MrBayes29. The pictures of different cattle species given in the tree was drawn using Inkscape 1.0. (https://inkscape.org). The figure was edited in Inkscape 1.0.

