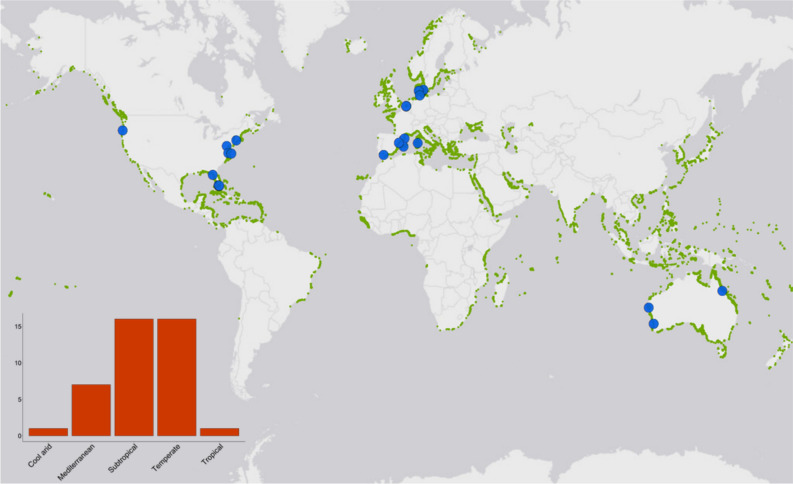
Figure 2.
Map showing the location of studies used in our meta-analysis and the global distribution of seagrass80. Inset plot shows the count of studies depending on the broad climatic region where they were undertaken. Seagrass distribution data use layers ‘WCMC_013_014_SeagrassesPt_v6’ and ‘WCMC_013_014_SeagrassesPy_v6’, which can be accessed at https://gis.unep-wcmc.org/arcgis/rest/services/marine/WCMC_013_014_Seagrass_WMS/MapServer.

