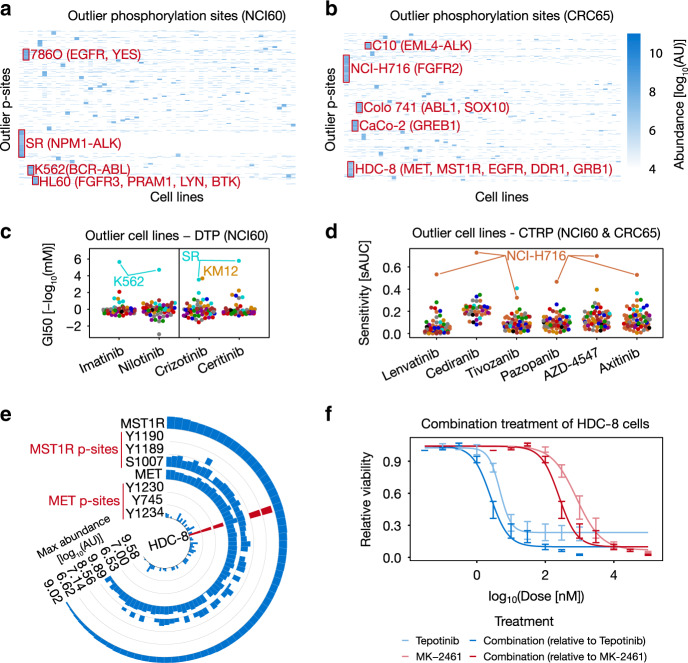
Fig. 3. Outlier proteins and p-sites abundance often explain drug sensitivity.
a, b Heatmaps of outlier p-sites in the a NCI60 (n = 60 cell lines) and b CRC65 panel (n = 64 cell lines). Selected cell lines and p-site clusters are annotated. c, d Beeswarm plots visualizing selected drugs for which outlier cell lines were identified in the c DTP (n = 59 cell lines) and d CTRP drug-sensitivity datasets (Lenvatinib: n = 71 cell lines; Cediranib: n = 41 cell lines; Tivozanib: n = 72 cell lines; Pazopanib: n = 71 cell lines; AZD4547: n = 66 cell lines; Axitinib: n = 69 cell lines; sAUC = 1-standardized area under the dose-response curve; GI50 = growth inhibitory concentration analogous to an IC50). Cell lines are colored by tissue of origin as in Fig. 1. e Circular bar plot highlighting the outlier abundance of selected pY-sites on MET and MST1R in HDC-8 cells (red bars; n = 65 cell lines). f Dose-response curves visualizing the synergistic effect of targeting MET (using Tepotinib) and MST1R (using MK-2461) simultaneously in HDC-8 cells. Error bars represent the minimum and maximum relative viability of technical triplicates. Source data are provided as a Source Data file.

