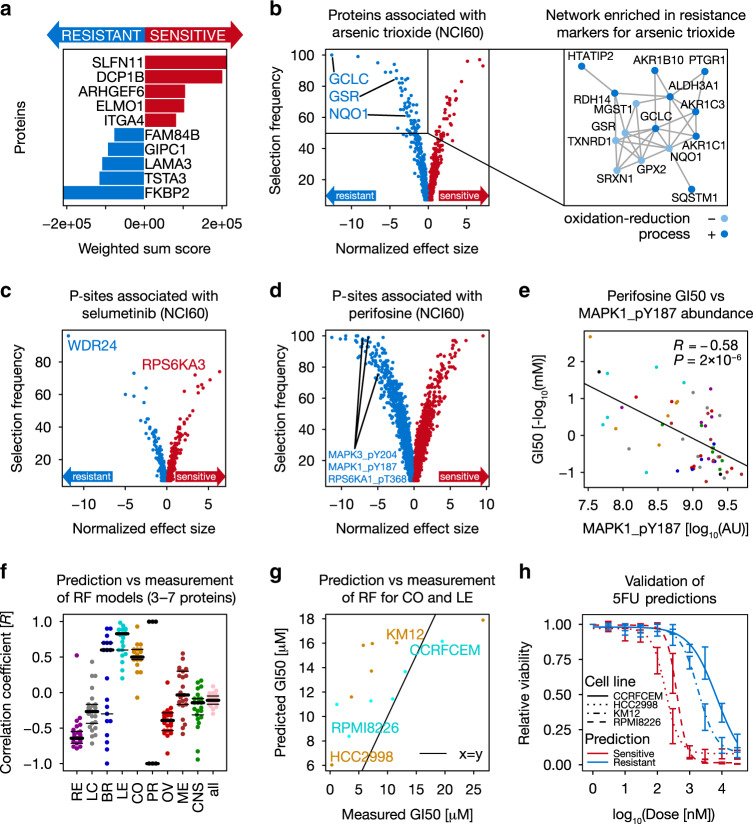
Fig. 4. Correlation-based (phospho)proteome markers often explain drug sensitivity.
a General sensitivity and resistance protein markers of the NCI60 panel in the DTP drug response dataset (Supplementary Methods). b Volcano plot of protein markers associated with response to Arsenic trioxide in the NCI60 panel (Supplementary Methods). GCLC, GSR, and NQO1 are resistance markers (left panel). Right panel: highly connected network (according to https://string-db.org/) enriched by Arsenic trioxide resistance markers. c, d Volcano plots of p-sites associated with c Selumetinib and d Perifosine sensitivity and resistance (Supplementary Methods). e Significant negative correlation between Perifosine sensitivity and MAPK1_pY187 abundance (n = 60 cell lines; Pearson correlation; P < 0.05). Cell lines are colored by tissue of origin as in Fig. 1. f Prediction accuracy (Pearson correlation) between predicted and measured 5FU sensitivity of the top 5 random forest models combining 3–7 proteins involved in 5FU metabolism (n = 25 models each; Supplementary Methods). g Correlation between predicted (using a random forest model) and measured 5FU sensitivity for leukemia and colorectal cancer cell lines (n = 13 cell lines; DTP data; not used for training). KM12 (colon) and CCRFCEM (leukemia) are resistant cell lines, while HCC2998 (colon) and RPMI826 (leukemia) are sensitive cell lines (GI50 = growth inhibitory concentration analogous to an IC50). Cell lines are colored by tissue of origin as in Fig. 1. h Cell viability assay confirming the predicted drug sensitivity (red) and resistance (blue) of cell lines from panel g. Error bars represent the minimum and maximum relative viability of technical triplicates. Source data are provided as a Source Data file.

