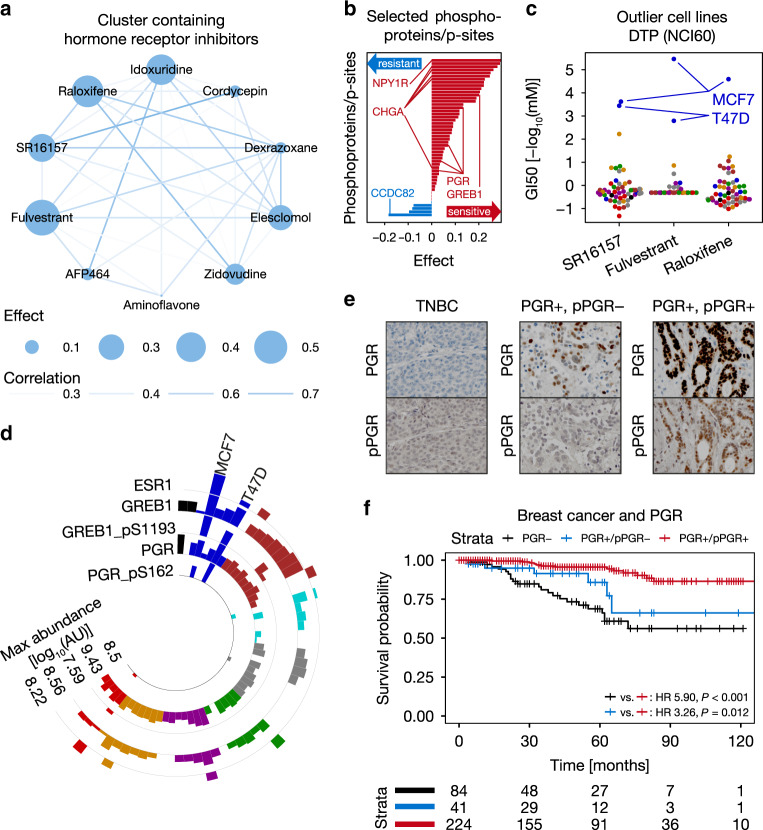
Fig. 6. High phosphorylation of PGR predicts benefit from endocrine therapy in breast cancer.
a Cluster containing several hormone-receptor inhibitors identified by sparse multiblock partial least square regression (SMBPLSR; n = 10 drugs). Nodes represent compounds with size indicating effect (SMBPLSR score of drugs; Supplementary Methods), while edges visualize the correlation of the sensitivity between two drugs across cell lines (white = low, blue = high). b Bar plot showing examples for phosphoprotein or p-site markers associated with drugs in panel a including PGR (pS162) and GREB1 (pS1193; sensitivity markers in red, resistance markers in blue). c Sensitivity of NCI60 cell lines towards hormone-receptor inhibitors (SR16157: n = 52 cell lines; Fulvestrant: n = 52 cell lines; Raloxifene: n = 53 cell lines). MCF7 and T47D cells are particularly sensitive outlier cell lines. Cell lines are colored by tissue of origin as in Fig. 1. d Circular bar plot showing relative protein expression of ESR1, GREB1, and PGR, as well as the abundance of GREB1_pS1193 and PGR_pS162 across the NCI60 panel (n = 57 cell lines). Cell lines are colored by tissue of origin as in Fig. 1. e Representative pictures of breast cancer tissue microarrays (TMAs) stained for PGR protein and PGR_pS162 (pPGR). Triple-negative breast cancer (TNBC) cases served as negative controls. f Kaplan–Meier plot of breast cancer patients showing that PGR+/pPGR+ patients survive significantly longer than PGR+/pPGR− and PGR- patients (log-rank test). The number of patients at risk is shown below the Kaplan–Meier plot. Source data are provided as a Source Data file.

