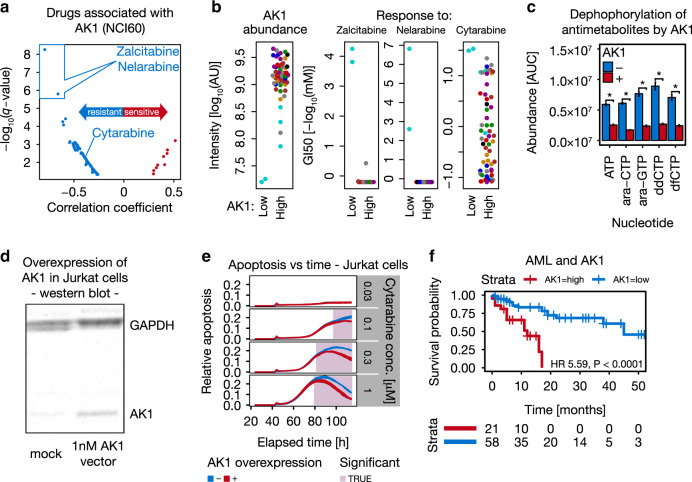
Fig. 7. High AK1 levels signify chemotherapy resistance in AML.
a Correlation analysis (Supplementary Methods) identified AK1 protein expression to be strongly negatively correlated with response to antimetabolite drugs including Zalcitabine and Nelarabine. b AK1 expression (left panel) and drug-sensitivity analysis of Zalcitabine, Nelarabine and Cytarabine in the NCI60 panel (right three panels; n = 59 cell lines). Cell lines are colored by tissue of origin as in Fig. 1. c Quantification of antimetabolites by multiple reaction monitoring (Supplementary Methods) in their active nucleotide triphosphate form (NTP) showing that AK1 decreases NTP abundance significantly in vitro (t-test; P < 0.05; ara-CTP = Cytarabine; ara-GTP = Nelarabine; ddCTP = Zalcitabine; dfCTP = Gemcitabine). ATP served as a positive control. Error bars represent the standard deviation of three biological replicates. d Western blot confirming successful overexpression of AK1 in Jurkat cells (Supplementary Methods). e AK1 overexpression (red) in combination with Cytarabine treatment in Jurkat cells resulted in significantly reduced apoptosis in a concentration- and time-dependent manner (time-point-wise t-test, P < 0.05). The width of blue and red lines represents the range of relative apoptosis across three technical replicates. f Kaplan–Meier analysis of AML patients stratified by AK1 expression. Patients with low AK1 expression (blue) survive significantly longer than patients with high AK1 expression (red; log-rank test, P < 0.0001). The number of patients at risk is shown below the Kaplan–Meier plot. Source data are provided as a Source Data file.

