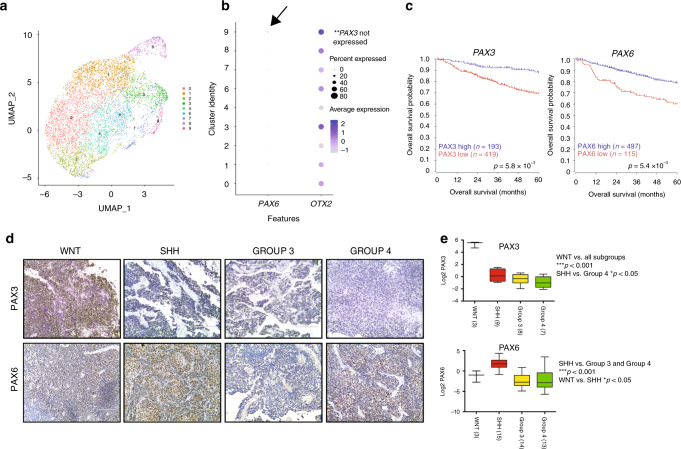
Fig. 2. PAX3 and PAX6 protein levels are lower in Group 3 MB, and lower expression of both genes is associated with reduced survival in patients.
a Nine transcriptionally distinct cell populations from two Group 3 MB patient samples as previously defined11. Of note, clusters 5, 10, and 11 were classified as non-tumor clusters and removed for downstream analysis. b Dot plot demonstrating the frequency and average expression of PAX6 (left) and OTX2 (right) within nine transcriptionally distinct cell populations from N = 2 Group 3 MB patient samples. Arrow denotes minimal expression of PAX6 in cluster 9. PAX3 was not detected in this dataset. c Low expression of both PAX3 and PAX6 is associated with significantly reduced overall patient survival in N = 612 MB patient samples. p-Values were determined using the log-rank method. d Representative images of PAX3 and PAX6 staining in FFPE sections from all four MB subgroups. Scale = 200 μm. e Proteomic analysis (Boston cohort) demonstrates low expression of PAX3 (N = 27 patient samples) and PAX6 (N = 45 patient samples) in Group 3 MB. For PAX3: WNT vs all other subgroups, ***p < 0.001, SHH vs Group 4: *p < 0.05, all other pairs NS. For PAX6: WNT vs SHH, *p < 0.05, SHH vs Group 3 and Group 4 ***p < 0.001, all other pairs NS. Significance was determined by one-way ANOVA.

