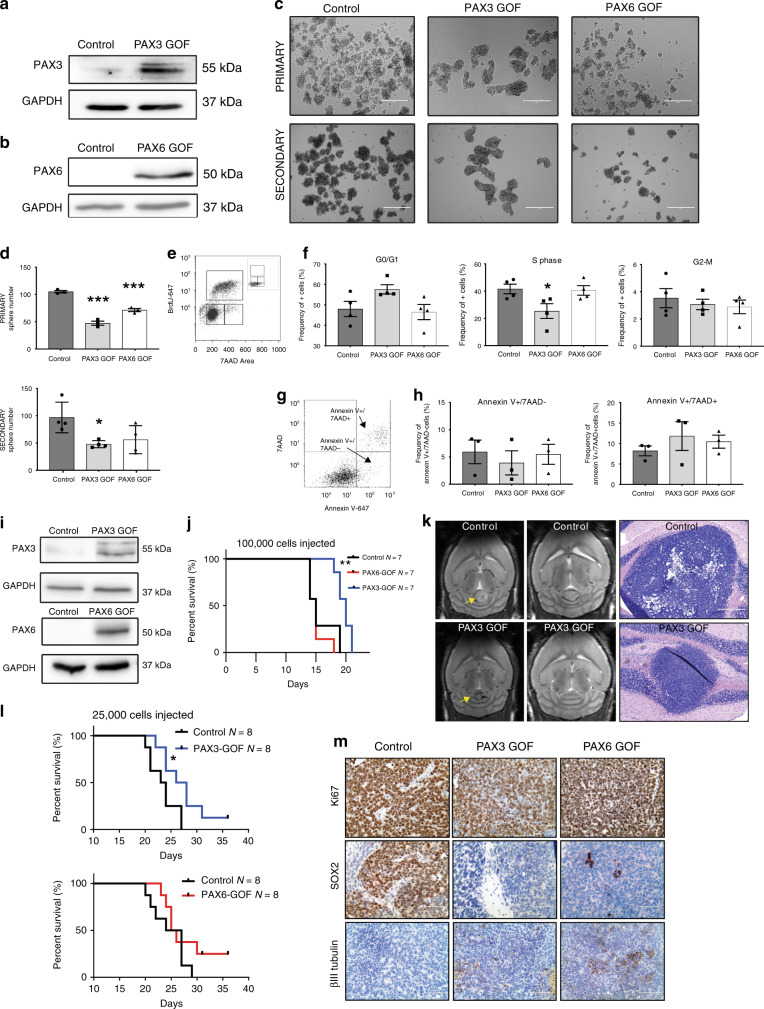
Fig. 4. Increased PAX3 and PAX6 expression reduces tumorigenic properties of Group 3 MB cells.
a, b PAX3 (a) and PAX6 (b) overexpression in HDMB03 Group 3 MB tumorspheres. GAPDH serves as the loading control. c, d Representative images (c) and quantification (d) of primary and secondary tumorspheres, with increased expression of PAX3 and PAX6. Error bars: SEM. Scale = 200 μm. N = 3 biological replicates for primary tumorspheres and N = 4 biological replicates for secondary tumorspheres. Significance was determined by ANOVA and a Tukey’s test for multiple comparisons. For primary tumorspheres: PAX3 GOF, p < 0.0001; PAX6 GOF, p = 0.0004. For secondary tumorspheres: PAX3 GOF, p = 0.023. e, f BrdU incorporation analysis in PAX3 and PAX6 GOF cells. Representative dot plot of gating strategy for BrdU analyses with 7AAD only control (inset) (e) and quantification of cell cycle phases in control, PAX3 GOF, and PAX6 GOF tumorspheres (f). Data are presented as mean values ± SEM. For PAX3 GOF “S” phase, p = 0.043. N = 4 biological replicates. g, h Annexin V/7AAD analyses of cell viability in PAX3 and PAX6 GOF cells. Representative dot plot of gating strategy for Annexin V/7AAD analyses (g) and quantification of live/dead cells in control, PAX3, and PAX6 GOF tumorspheres (h). Data are presented as mean values ± SEM. N = 3 biological replicates. For all flow cytometry data, signficance was determined by ANOVA followed by a Dunnett for multiple comparisons. i Increased PAX3 (upper) and PAX6 (lower) expression in HDMB03 cells utilized for intracerebellar transplants. GAPDH serves as the loading control. j Kaplan–Meier curves depicting overall survival in animals transplanted with 1 × 10⁵ control, PAX3, or PAX6 GOF cells. p-Values determined using the log-rank method and p = 0.0014. k MRIs from two independent control and PAX3 GOF tumors (left) and H&E staining (right) from control and PAX3 GOF xenografts. Arrows denote tumors in the cerebellum. Scale = 400 μm. l Survival in xenografts transplanted with 2.5 × 10⁴ control, PAX3, or PAX6 GOF cells. p-Values determined using the log-rank method and p = 0.040. m Representative images of Ki67, SOX2, and βIII tubulin levels in control, PAX3, and PAX6 GOF HDMB03 MB tumor-bearing mice. Scale bar: 100 μm.

