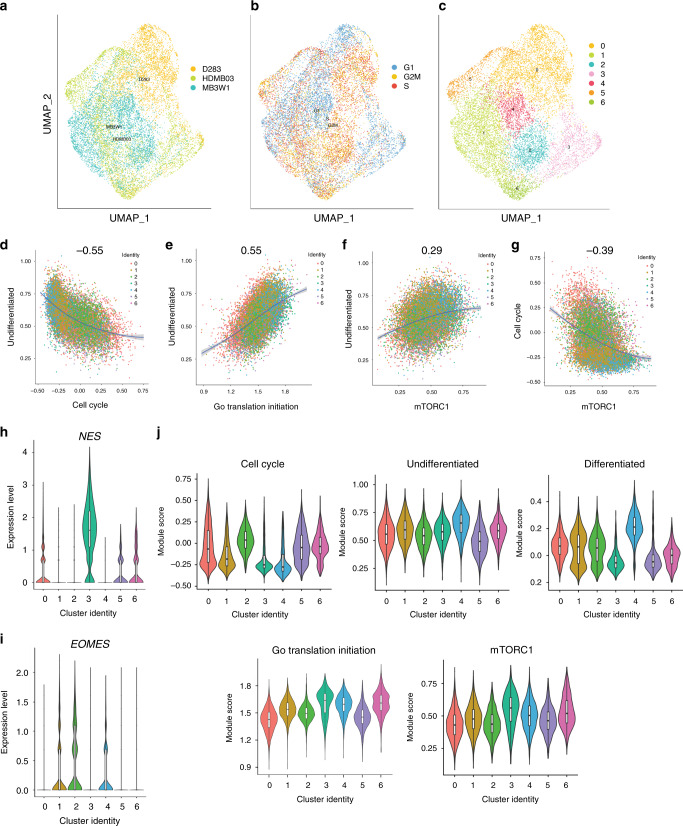
Fig. 6. Integrated scRNA-seq analyses of Group 3 tumorspheres reveals relationships between the undifferentiated stem/progenitor cell state and an mTORC1 gene expression signature.
a–c UMAP representations of integrated tumorsphere data from D283, HDMB03, and MB3W1 (a), cell cycle phases from integrated data (b), and transcriptionally distinct cell populations from integrated data (c). d–g Correlation plots displaying the relationship between the undifferentiated program and cell cycle (d), as well as the undifferentiated program and translation initiation (e), the undifferentiated program and our mTORC1 gene signature (f), and cell cycle and our mTORC1 gene signature (g) from integrated tumorsphere data. The mTORC1 gene signature overlaps with the broad translation initiation program, but is based on the curated list of genes provided in Supplementary Data 8, the majority of which are associated with the 4E-BP1 and S6 ribosomal protein arms of mTORC1 signaling, and are also direct OTX2 targets. h, i Expression of the neural stem cell marker Nestin (NES) and the differentiated unipolar brush cell marker Eomesodermin (EOMES) in clusters of the integrated tumorsphere data. j Expression of the cell cycle, undifferentiated, differentiated, and translation initiation programs, as well our mTORC1 gene expression signature across clusters in the integrated tumorsphere data. For the three biologically independent cell lines, n = 6307 cells (HDMB03), n = 5297 cells (D283), and n = 5099 cells (MB3W1). For all violin plots, the center line is the median, the 25th and 75th percentiles are depicted by the bottom and top of the box, respectively, and the whiskers extend to the minima and maxima.

