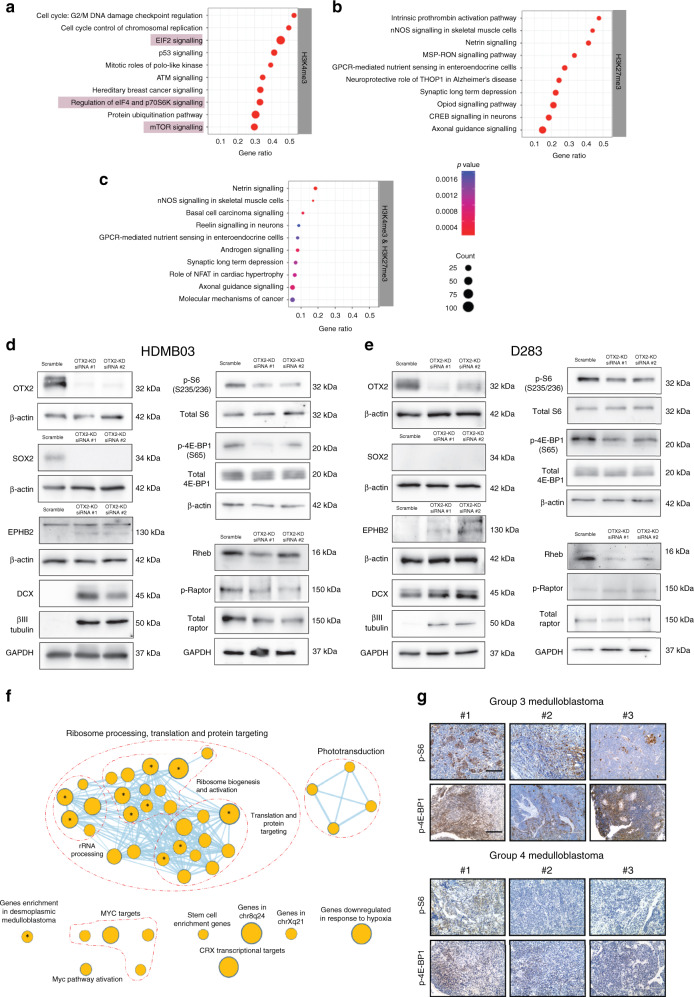
Fig. 7. Loss of OTX2 phenocopies PAX3 and PAX6 GOF in Group 3 MB cells.
a–c EIF2 and mTORC1 signaling (highlighted) associated with genes that have significant changes in the H3K4me3 modification, following OTX2 silencing in Group 3 MB tumorspheres. Significance was calculated using a right-tailed Fisher’s exact test. d, e OTX2 silencing in HDMB03 (d) and D283 (e) tumorspheres with two independent siRNAs reduces SOX2, p-S6, p-4E-BP1, and Rheb levels. The neuronal differentiation markers DCX, βIII tubulin, and EPHB2 are increased along with small increases in pRaptor in D283 tumorspheres only. Total S6, total 4E-BP1, total Raptor, GAPDH, and β-actin serve as loading controls. f Enriched biological processes and pathways determined using GSEA (Terms with FDR corrected q-value < 0.25) and visualized in Cytoscape v3.7.2 using Enrichmentmap. Each node in the map denotes a pathway, process or a transcription factor enrichment. The size of the nodes is proportional to the number of genes in the process. The nodes are connected when they share enriched genes. Nodes with asterisk denote the processes enriched with q < 0.05. g Representative images of p-S6 and p-4E-BP1 immunohistochemical staining in three independent FFPE Group 3 (upper) and Group 4 (lower) MB patient samples. Scale = 200 μm.

