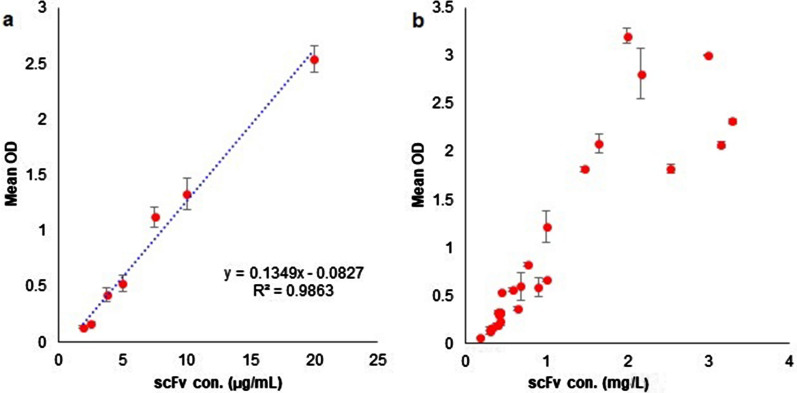
Fig. 2.
ELISA analysis. a Shows a calibration curve constructed by twofold dilution series of the purified anti-G17-Gly. The absorbance values and the standard scFv concentrations showed a satisfactory linear correlation considering R2 > 0.9. b Represents the overall concentration of the anti-G17-Gly scFv extracts under different experimental conditions. The mean absorbance values of the test samples were interpolated to the linear regression equation obtained from the calibration curve. The Mean OD stands for the average absorbance values of duplicate samples read at 450 nm and 630 nm to subtract background absorbance

