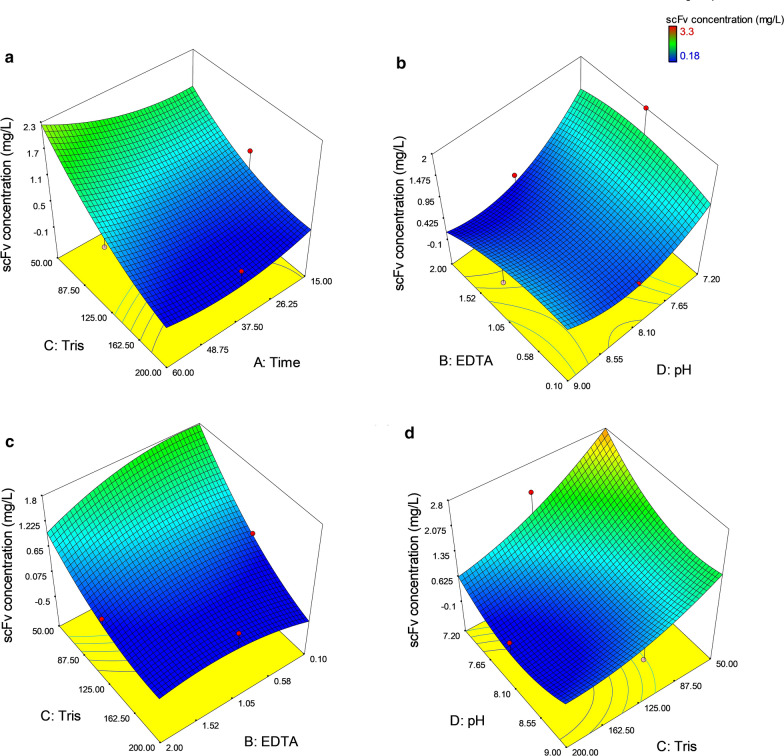
Fig. 4.
Response surface plots associated with the extraction yield of periplasmic anti-G17-Gly scFv. The statistically significant interaction terms effective in the anti-G17-Gly scFv extraction (mg/L) are showed by the response surface plots: a The interaction between incubation time and Tris–HCl concentration (AC); b The interaction between EDTA and pH (BD); c The interaction between EDTA and Tris–HCl concentration (BC); d The interaction between Tris–HCl concentration and pH (CD)

