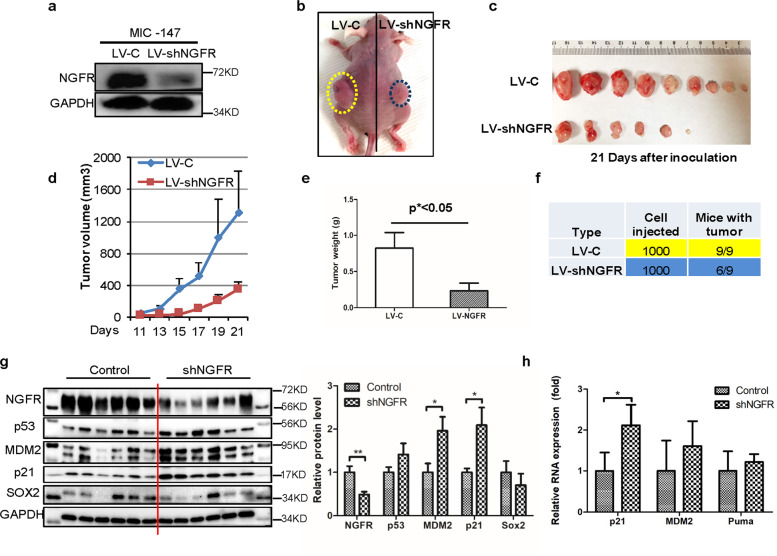
Fig. 7. Knockdown of NGFR inhibits MIC-derived tumor growth in vivo.
a Re-examination of NGFR levels in MIC cells used for xenograft tumors. WB analysis of NGFR levels was conducted with indicated antibodies in two MIC cell lines, MIC-147-control shRNA, and MIC-147-shNGFR, to confirm the knockdown efficiency of NGFR. b A representative image of subcutaneous xenografts in athymic nude mice 21 days after inoculation. c Xenograft tumor images showing that NGFR knockdown dramatically suppresses tumor growth in vivo after subcutaneous injection of 1000 MIC-147-LV-c or MIC-147-LV-shNGFR cells. d The tumor growth curve in volume. Tumor volumes were monitored during growth of MIC-derived xenograft tumors (mean ± SEM, n = 9). e A graph presenting the average tumor weight of each group as shown in c and d. f A table showing the tumor-initiation frequency in each group as shown in the above panels. g The p53 pathway is activated by NGFR knockdown in xenograft tumors. The protein levels of p53, p21, MDM2, and SOX2 were determined by WB with antibodies as indicated (mean ± SEM, n = 6). The quantification of each protein in both control siRNA and NGFR-depleted tumors is presented in a graph on the right. h The mRNA levels of p53 target genes in both control siRNA and NGFR-depleted xenograft tumors were detected by Q-PCR analysis. Data represent mean ± SEM. *p < 0.05, **p < 0.01 by two-tailed t-test.

