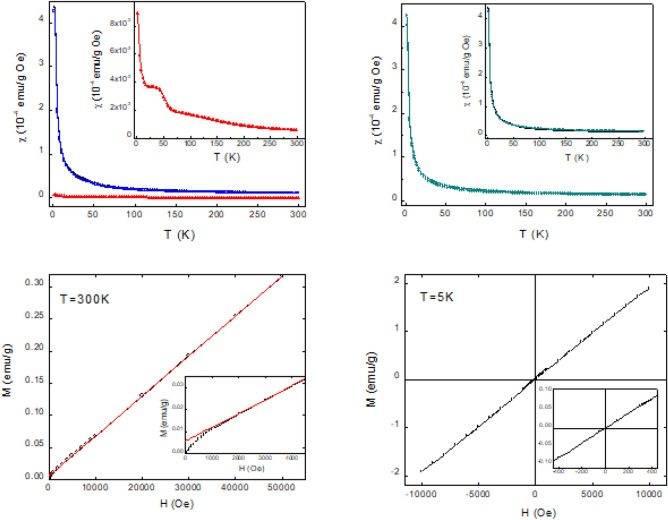
Figure 6.
(Top-left) Temperature dependence of mass magnetic susceptibility at 1kOe for pristine (red curve) and IL-treated (black curve) samples. Blue curve represents the IL-treated curve after subtraction of pristine contribution. The Inset shows pristine χ-curve in an enlarged scale. (Top-right) ZFC and FC magnetic susceptibility for IL-treated sample at 20 Oe. In the Inset FC magnetic susceptibility at 20 Oe (green curve) and at 1 kOe (black curve) are compared. (Bottom) Magnetization as function of H measured at room temperature (bottom-left) and at 5 K (bottom-right) In the Insets an enlargement of the respective curve is reported in the low field region.

