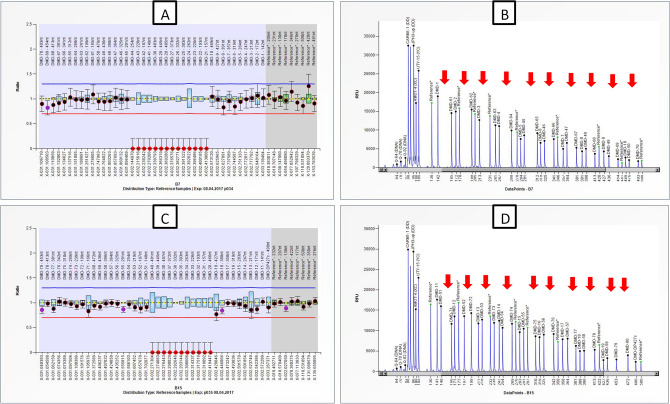
Figure 1.
Figure represents ratio chart obtained through coffalyser.NET showing profile of DMD subject with long stretch deletion between exon 20 and 44. (A, B) Ratio chart and electropherogram depicting exonic deletions from exon 41 to 44 and exon 21 to 30 covered by P034 probe-mix. (C, D) Ratio chart and electropherogram depicting deletions from exon 31 to 40 and exon 20 covered by P035 probe-mix. P034 and P035 covers probes of all 79 exons of the DMD gene. Ratio between 0.70 and 1.30 was considered in the normal range while ratio of 0.00 was considered as deletion (depicted in red dots in ratio chart and red arrows in the electropherogram).

