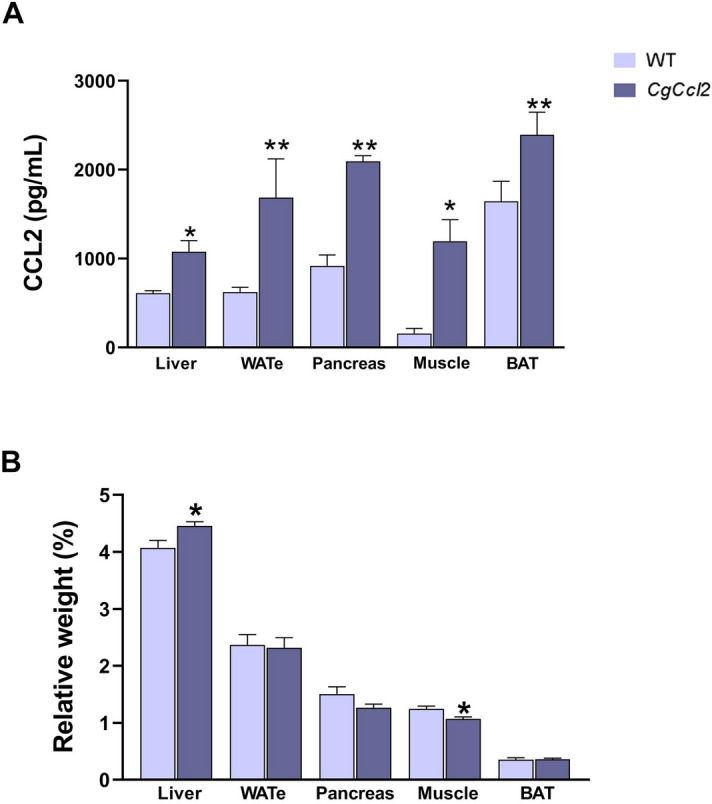
Figure 2.

Increased Ccl2 levels in the metabolic tissues from the Ccl2 cisgenic mice (CgCcl2). The results are shown for (A) the Ccl2 concentrations in the liver, white adipose tissue (eWAT), pancreas, muscle and brown adipose tissue (BAT) of the wild-type (WT) and CgCcl2 mice and (B) the relative weight of the selected tissues. The results are shown as the mean ± SEM (n = 8 for each group). *P < 0.05; **P < 0.001, with respect to the WT control littermates.
